| Research | Editorships | Biography | Publications | Teaching | Group Members | Group Meetings | Projects | Software | Sponsors | Ph.D. Students | Postdocs |
|
||||||
|
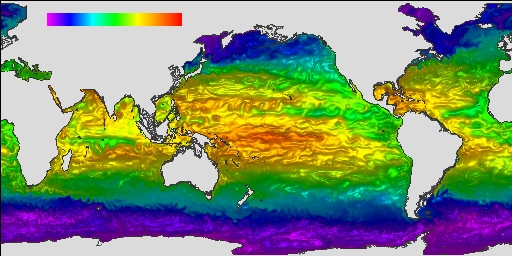
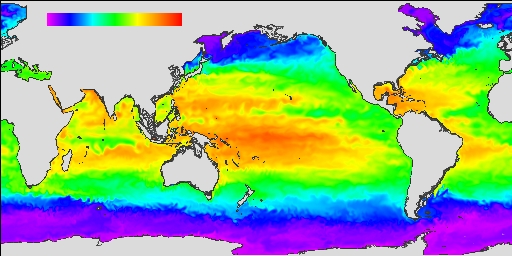
Images show comparison of two rendered images of tepmerature data.
The general circulation of the ocean in the global climate system is
critical to our ability to predict climate changes and their effects.
These visualizations are from high quality time-varying volume data.
Detailed information about this dataset and our visualizations can be found here. |
||||||
|
Ph.D. Students Vinod Anupam (1994) Fausto Bernardini (1996) William Blanke (2001) Karlapalem Chandrasekhar Jindon Chen (1995) Shun-Chuan Albert Chen Steve Cutchin (2000) Tamal Dey (1991) Susan Evans (2001) Insung Ihm (1991) Myung-Soo Kim (1988) Kwun-nan Lin (1996) Valerio Pascucci (2000) Sang-Min Park Andrew Royappa (1992) Daniel R. Schikore (1997) Bong-Soo Sohn (2005) Vinay Siddahanavalli Zeyun Yu Jessica Zhang (2005) Peinan Zhang (1996) Xiaoyu Zhang (2001) Wen-Qi Zhao GuoZhong Zhuang (2000) |
||||||