|
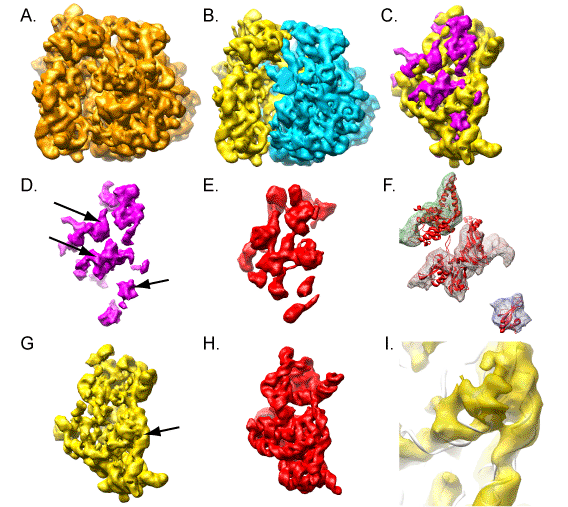
Segmentation of a cryoEM map of no symmetry at 10Å resolution.
(A) The reconstructed cryoEM maps of 70S ribosome aminoacyl-tRNA from E. coli complex.
(B) Segmentation of 70S ribosome map into 30S and 50S subunits.
The 30S subunit is represented by yellow density while the 50S subunit is shown in blue.
The 30S subunit is further segmented in protein (purple) and RNA (yellow) in (C).
Comparisons of automatic segmentation and the X-ray structure of the 30S subunit are shown in (D-J).
The segmented density for the protein (D) and RNA (G) is shown next to the protein (red, E)
and RNA (red, H) from the X-ray structure rendered at ~10Å resolution.
A third round of automated segmentation on the protein component of the 30S subunit
successfully revealed several individual components (mesh, F).
No additional segmentation was done on the RNA component of the 30S subunit.
The X-ray structure of the protein components and RNA
are also shown superimposed on the segmented density in (F,J).
The arrows in (D,G) indicate the regions depicted in (F,I)
|
Additional images for Ribosome structure
generated using
TexMol ,
VolRover
Links to movies:
Ribosome,
Superoxide Dismutase,
NMJ LOD ,
Hemoglobin ,
Virus ,
Phage
|
|
Teaching
Interactive Computer Graphics: CS 354 (#52495) Fall 2010
CS384R,CAM395T,BME383J (#52590,#65115) Geometric (Bio-) Modeling and Visualization, Fall 2010
Previous years
|
|
