End-user software problems take too much time to resolve, in part due to unclear or ambiguous error messages. The quality of error messages embedded within software is unlikely to improve given the variety of contexts in which errors can occur, the programming complexity of sophisticated error reporting, and the modular structure of modern applications.While vendors supply documents, help systems, and websites to support end users, it is still difficult for users to figure out how to resolve their problems.
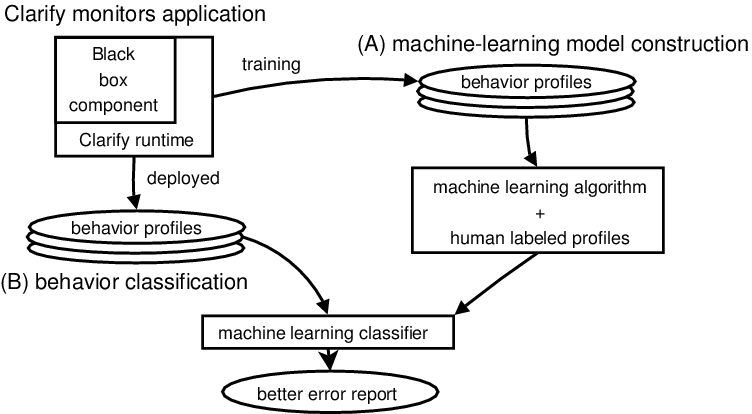
Clarify improves error reporting by monitoring software execution and determining if a particular execution is an instance of a known error. As a program executes, Clarify builds a compact abstraction of the program's behavior (a behavior profile) using control flow information. Clarify classifies behavior profiles using a machine learning model trained on known errors by vendors, support organizations or other users, enabling them to better disseminate error workarounds by matching user behavior profiles with known problems. Clarify provides a way for an average user to get solutions to software problems with less effort.
A prototype implementation, Skepsis, demonstrates the efficacy
of the Clarify approach. Skepsis collects three behavior profiles
based on program control flow: function counting, path profiling,
and a new technique, call-tree profiling. We evaluate Skepsis
on confusing error messages currently emitted by large, mature
programs including the gcc compiler and Microsoft's Visual Fox-
Pro database. Using call-tree profiling, Skepsis achieves an average
classification accuracy of 97% across a range of nine benchmarks
on two operating systems, while function counting and path profiling
achieve average classification accuracies of 92% and 94%
respectively.
The following scenario illustrates how Clarify works.
|
Below is an example of Clarify's program behavior profiles of given sample program. All three behavior profiles are fixed length feature vectors that are presented to the machine-learning models as input. Each profile uses counters whose value is normalized by the total number of counted events in a run. Normalization allows comparison of runs with different input lengths, but must be done in a way that ensures rare events are not normalized to zero, so rare events are never lost.
Right table shows the feature vectors for each of the three profiles, for three runs of the sample program, each with different values for the variables n and c. Each row is a feature, and the column of normalized feature value counts for a given run comprises the feature vector for that run. Feature vectors for a particular profile (e.g., function counting) can be compared against each other, but not against vectors from another behavior profile. Note that both function counting and path profiling do not distinguish between n=0, c=1, and n=1, c=1 (the feature vectors are identical), while CTP-D2 does distinguish these cases.
For function counting, each function's normalized count is a feature. For path profiling, each path's normalized count is a feature. The paths are not explicit in the program listing, but the zeroth path in main and A correspond to the conditional being taken. For call-tree profiling, the normalized count for each depth-bounded subtree of the activation tree is a feature. The complete feature space is very large for path profiling and call-tree profiling, so Clarify represents it sparsely, i.e., missing features are assumed zero valued.
|
|
For detailed description, please click on each benchmark.
| Benchmark | Classes | Instances | Accuracy(%) | ||
|---|---|---|---|---|---|
| Function Counting | Path Profiling | Call-tree Profiling | |||
| mpg321 | 4 | 282 | 89.7 | 87.9 | 88.7 |
| gzprintf | 4 | 600 | 79.2 | 75.0 | 93.2 |
| gcc | 5 | 1,582 | 87.3 | 92.3 | 94.5 |
| FoxPro | 4 | 184 | 91.3 | 95.6 | 100.0 |
| latex | 9 | 1,918 | 94.4 | 97.7 | 98.6 |
| iptables | 5 | 131 | 85.5 | 97.7 | 98.5 |
| iproute2 | 4 | 146 | 99.1 | 99.5 | 99.6 |
| apache | 8 | 8,192 | 100.0 | 100.0 | 100.0 |
| lynx | 4 | 615 | 99.8 | 99.8 | 100.0 |
| Average | - | - | 91.8 | 93.9 | 97.0 |
Jason V. Davis, Jungwoo Ha, Hany E. Ramadan, Christopher J. Rossbach, and Emmett Witchel. "Cost-sensitive decision tree learning for forensic classification". Proc. 17th European Conference on Machine Learning, 2006
Last modified: Mon 12 Feb 2007 05:15:51 PM CST

