|
mAChE (a): the isosurface at 0.5 from the accessibility function;
(b): the wire frame of the isosurface and an outer sphere;
(c): a zoomed-in picture to show the refined cavity;
(d): the adaptive tetrahedral mesh of the volume between the isosurface
and an outer sphere. The color on the isosurface represents
the distribution of the potential function, the color map is:
(-inf, -0.5) - red; [-0.5, 0.5] - white; (0.5, +inf) - blue.
The figures appear in
3D Finite Element Meshing from Imaging Data,
Computer Methods in Applied Mechanics and Engineering (CMAME)
on Unstructured Mesh Generation, 194, 48-49, 5083-5106, 2005.
Additional
images for 3D Finite Element Meshing from Imaging Data
|

|
|
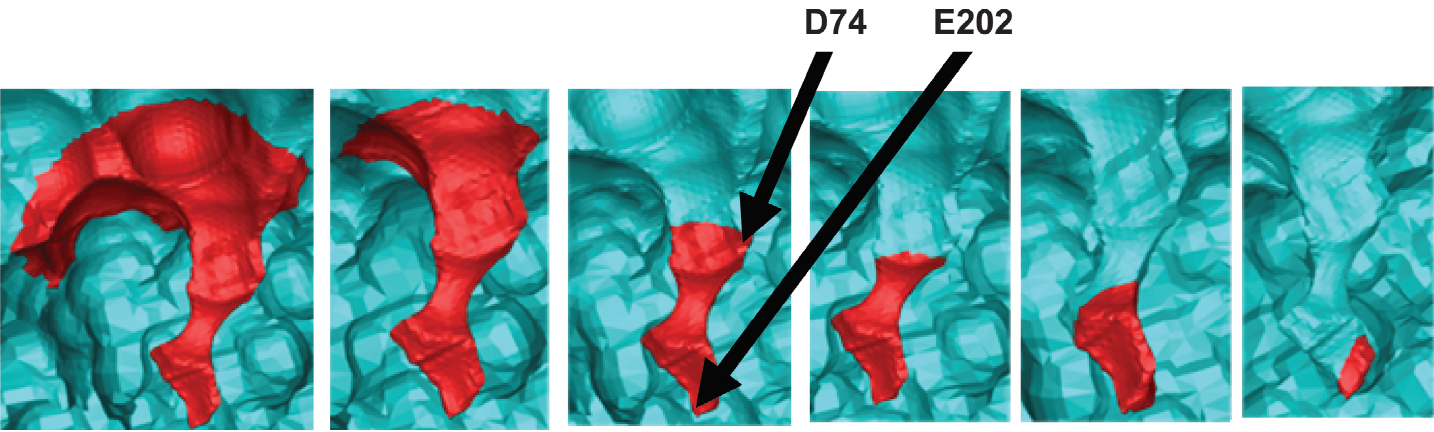
Reactive boundary definitions for mAChE. The figures appear in
Continuum Diffusion Reaction Rate Calculations of Wild Type
and Mutant Mouse Acetylcholinesterase: Adaptive Finite Element Analysis,
Biophysical Journal, 87(3):1558-1566, 2004.
|
|
|