


mapping to it. Iterations move
the centroids closer to their destination.
Each point labeled with its nearest centroid.
The goal of this assignment is to use thread-level parallelism, coarse, and fine-grain locking, as well as barrier synchronization to solve a classic data-parallel problem: K-means.
K-Means is a machine-learning algorithm most commonly used for unsupervised learning. Suppose you have a data set where each data point has a set of features, but you don't have labels for them, so training a classifier to bin the data into classes cannot rely on supervised algorithms (e.g. Support Vector Machines, which learn hypothesis functions to predict labels given features).
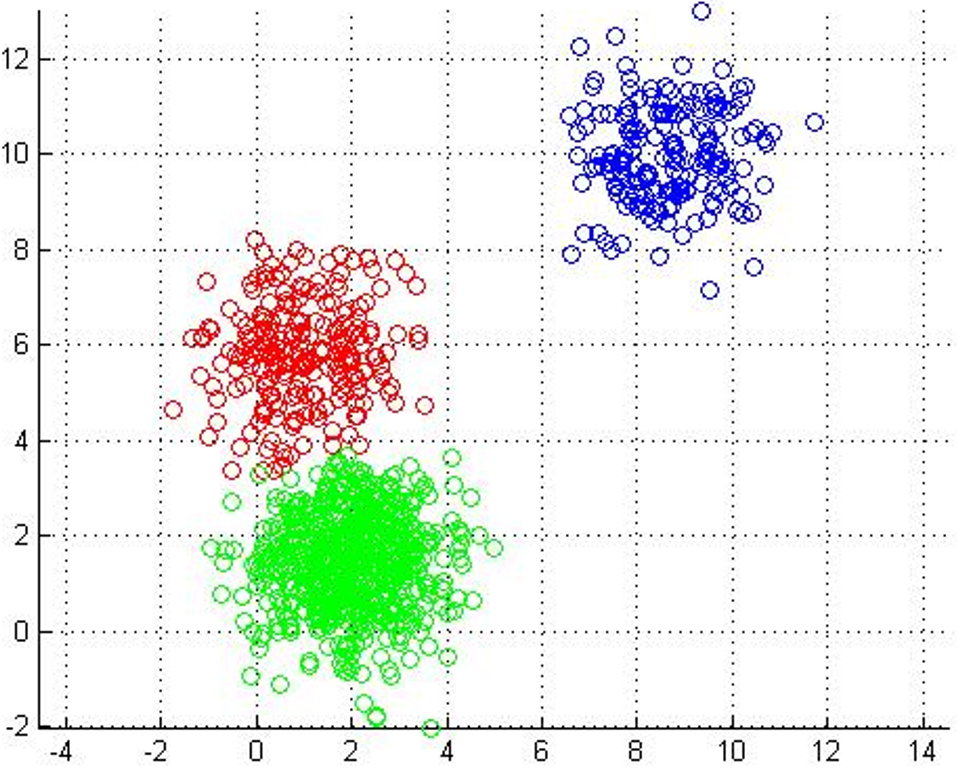
One of the most straightforward things we can do with unlabeled data is to look for groups of data in our dataset which are similar: clusters. K-Means is a "clustering" algorithms. K-Means stores k centroids that define clusters. A point is considered to be in a particular cluster if it is closer to that cluster's centroid than to any other centroid. K-Means finds these centroids by alternately assigning data points to clusters based on a current version of the centroids, and then re-computing the centroids based on the current assignment of data points to clusters. The behavior the algorithm can be visualized as follows:
|
|
|
|
|
| Initial input | Choose three random centers | Map each point to its nearest centroid | New centroid is mean of all points mapping to it. Iterations move the centroids closer to their destination. |
Centroids stop moving. Each point labeled with its nearest centroid. |
In the clustering problem, we are given a training set
x(1),...,x(m), and want to group the data into
cohesive "clusters." We are given feature vectors for each data
point x(i) encoded as floating-point vectors in D-dimensional space.
But we have no labels y(i). Our goal is to predict k centroids
and a label c(i) for each datapoint.
Here is some pseudo-code implementing k-means:
kmeans(dataSet, k) {

  // initialize centroids randomly
  numFeatures = dataSet.getNumFeatures();
  centroids = randomCentroids(numFeatures, k);

  // book-keeping
  iterations = 0;
  oldCentroids = null;

  // core algorithm
  while(!done) {

    oldCentroids = centroids;
    iterations++;

    // labels is a mapping from each point in the dataset
    // to the nearest (euclidean distance) centroid
    labels = findNearestCentroids(dataSet, centroids);

    // the new centroids are the average
    // of all the points that map to each
    // centroid
    centroids = averageLabeledCentroids(dataSet, labels, k);
    done = iterations > MAX_ITERS || converged(centroids, oldCentroids);
}
We strongly recommend you do this lab using C/C++ and pthreads. However, it is not a hard requirement--if you wish to use another language, it is fine as long as it supports or provides access to thread management and locking APIs similar to those exported by pthreads: you'll need support for creating and waiting for threads, creating/destroying and using locks, and for using hardware-supported atomic instructions. Using language-level synchronization support (e.g. synchronized or atomic keywords) is not acceptable--it can preserve correctness obviously, but it sidesteps the point of the lab. You can meet these requirements in almost any language, but it is worth talking to me or the TA to be sure if you're going to use something other than C/C++.
Deliverables will be detailed below, but the focus is on a writeup that provides performance measurements as graphs, and answers (perhaps speculatively) a number of questions. Spending some time setting yourself up to quickly and easily collect and visualize performance data is a worthwhile time investment since it will come up over and over in this lab and for the rest of the course.
In step 1 of the lab, you will write a program that accepts command-line parameters to specify the following:
--clusters:integer valued k -- the number of clusters to find--threshold:floating-point-valued threshold for convergence--iterations:integer-valued maximum number of iterations to run k-means--workers:integer-valued number of threads--input:string-valued path to an input file.The output of your program should include:
For example, the following command-line invoked on zwerdling.cs.utexas.edu
yield corresponding output in our sample solution:
    ./kmeans --input kmeans-sample-inputs/color100 --workers 4 --threshold 0.00001 --iterations 0 --clusters 4
    Converged in 19 iterations (max=0)
    parallel work completed in 811 usec
    Cluster 0 center: [-0.170][1.592][1.114][2.429][0.102][-3.015][-0.057][-0.483][-0.646]
    Cluster 1 center: [2.281][0.622][-1.899][-0.021][-0.907][-0.495][-0.168][-0.355][-0.116]
    Cluster 2 center: [0.520][0.867][-0.059][-0.157][0.343][0.065][-0.829][-0.159][0.538]
    Cluster 3 center: [2.359][1.081][-2.167][2.755][-0.030][-3.740][-0.737][-0.915][-0.222]
The --iterations and --threshold options have some
nuance and should be given well-chosen defaults. The --iterations
option specifies the maximum number of times the loop will run, even the clustering
does not converge (MAX_ITERS) in the code fragment above. The --threshold
option specifies the minimum euclidean distance between oldCenters and
centers required for the algorithm to terminate. The --iterations
option will operate as essentially just a fall-back mechanism to ensure termination
in this lab: it's very useful for debugging. You should code your solution such that
the default value of --iterations is 0, which will mean that
MAX_ITERS isn't enforced. Your default value of --threshold
should be 0.00001f. However, note that below, experiments specify a
much lower threshold: this is because we are measuring speedup/throughput over
a set number of iterations, and we don't actually
While the options allow you to specify a number of workers, your initial solution should just implement a single-threaded version of the algorithm. This greatly simplifies debugging. More importantly, the single-threaded version will be the baseline against which to measure subsequent parallel versions.
Input files will follow the format below, where the first line specifies the integer
valued number of points in the input, and each subsequent line describes a dim-dimensional
point, and where each dimension's value is a floating point number. We recommend you use
single precision float in your program rather than double but
this is not a hard requirement.
    <Number-of-points>
      1 <dim0-value> <dim1-value> ... <dim-(d-1)-value>
      2 <dim0-value> <dim1-value> ... <dim-(d-1)-value>
		  ...
      <Number-of-points>  <dim0-value> <dim1-value> ... <dim-(d-1)-value>
generate.py utility to create
your own inputs. Invoke generate.py with no
command line options to see instructions for using the utility.
K-means is a readily parallelizable algorithm, so there are many approaches to parallelizing it. The most straightforward, given the material we've seen so far in this class, is a bulk-synchronous parallelization (BSP) which forks some number of threads across which some partition of the input data set is partitioned. Your solution to lab0 may come in very handy at this point.
While partitioning the input across some number of threads is
straightforward (be sure you handle corner cases where threads
do not get an even partition of the input), you should find you
need some synchronization to ensure that updates to the centroids are well
synchronized. Assuming you do not spawn new threads for each
iteration (you don't, right?), you additionally need some barrier
synchronization at the beginning and end of each iteration to ensure that
each thread is ready/done when you decide if the algorithm has converged.
Your first parallelization should use a single lock to synchronize
access to the cluster centers. We will compare performance when the
the lock is implemented with pthread_mutex_t versus
pthread_spinlock_t. You should ensure that each worker
begins/finishes its iterations before the next iteration occurs
using some number of pthread_barrier_t primitives.
Using the
random-n65536-d32-c16.txt
sample input, --iterations 20, --clusters 16, and --threshold 0.00000001,
create a graph of speedup for pthread_mutex_t
and pthread_spinlock_t for your solution from 1 to twice the number of
physical processors on your machine for your solution at this step. Please
normalize your measurements with the single-threaded solution from
Step 1. This means that unlike in the first lab, where we simply reported
execution time, your graph should be a speedup graph.
Your solution in step 2 used locks over the centroids to synchronize updates from different threads. You may have found the scalability to be somewhat disappointing. In this step, you will additionally privatize your updates, so that each thread maintains private state during the bulk of the iteration, and requires synchronization only to add its partial aggregation of the data to the global update of the centroids.
Again using the
random-n65536-d32-c16.txt
sample input, --iterations 20, --clusters 16, and --threshold 0.00000001,
Create another speedup graph like the one above, where pthread_mutex_t
and pthread_spinlock_t primitives are used to synchronize en masse
updates accumulated privately by each thread at the end of each iteration. Again
your graph should be a speedup graph, where data are normalized to the
single-threaded Step 1 case.
In this step, you will implement your own barrier and pit it against the pthreads barrier implementation, maybe even beating its performance. You can take any of a number of implementation approaches. The textbook devotes some material to barrier implementation based on pthreads conditions. This is the path of least resistance, since you can draw most of the implemenation from there, so I'd strongly prefer that if you do design a condition-based barrier, refrain from resorting the implementation described there to maximize your own benefit from the exercise. You can implement a barrier based on one of the classical appraoches we discuss in class or design your own.
In your writeup, describe your design. Why did you choose the approach you chose? Under what conditions do you expect your barrier to perform best and worst. Finally compare the performance of your implementation using your barrier against your implementation using a pthreads barrier. This comparision should involve generating the another version of the speedup graphs described in previous sections. What performance trends do you observe with your barrier? Please explain or speculate about why your barrier exhibits the scalability trends you observe.
canvas turn in utility, you should turn in, along with your code, Makefiles, and measurement scripts,
a brief writeup with the scalability graphs requested above. Be sure that your
writeup includes sufficient text to enable us to understand which graphs
are which. Note that as will other labs in this course we will check
solutions for plagiarism using Moss.
A LaTeX template that includes placeholders for graphs and re-iterates any questions we expect answers for can be found here, (a build of that template is here).
Please report how much time you spent on the lab.
The description of k-means in this document draws heavily from one by Chris Piech. Thanks, Chris.
The sample inputs and generate.py utility are derived from
artifacts in the STAMP benchmark suite. I've been using them
for years: many thanks to Christos Kozyrakis and his students.