Evaluating the Wisdom of the Crowd: Kalshi Weather Market Calibration
Sep 2, 2025
Prediction markets are often touted as the ultimate tool for information aggregation. But how reliable are they really? Specifically, when Kalshi—a regulated US prediction market—assigns a 70% probability to a weather event, does that event occur 70% of the time?
This project evaluates the calibration of Kalshi's temperature markets across seven major US cities, analyzing thousands of markets to determine whether crowd-sourced predictions are truly accurate.
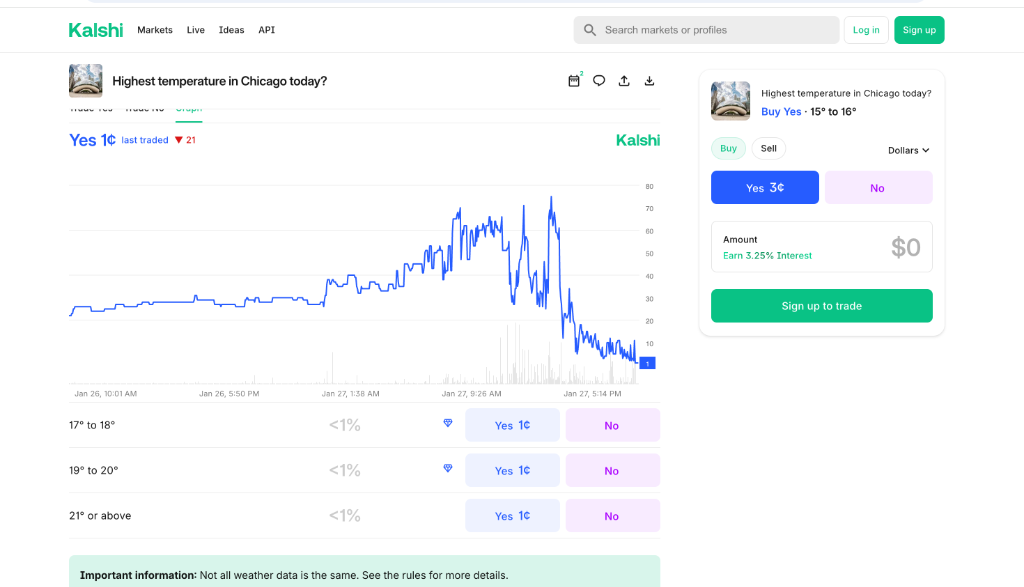
What Are Kalshi Weather Markets?
Kalshi offers regulated prediction markets on daily high temperature events. Traders can bet on whether the high temperature in cities like New York, Chicago, or Miami will be above or below specific thresholds. These markets aggregate the collective wisdom of traders, theoretically producing more accurate forecasts than simple climatological baselines.
The Multi-City Analysis
The analysis covers seven major US cities: New York City, Chicago, Miami, Denver, Los Angeles, Phoenix, and Seattle. Each city has different climate patterns and base rates, making cross-city comparison particularly interesting.
Technical Implementation
The project is built as an interactive Bokeh application that processes market data through a multi-stage pipeline:
Market Discovery: The system generates event tickers for all cities based on date patterns and fetches market lists via the Kalshi API, handling different data availability windows per city.
Price Data Collection: Downloads intraday "candlestick" (1-minute) data for all cities, computes mid-prices from bid-ask spreads, and converts these to market-implied probabilities.
Intelligent Caching: Implements city-specific caching to minimize redundant API calls. Processed data is stored in compressed pickle files organized by city.
Time-Series Processing: Converts all timestamps to Eastern Time for consistency, creates time-of-day indexing, and allows analysis at any point from the previous day at noon through event day at 9 PM.
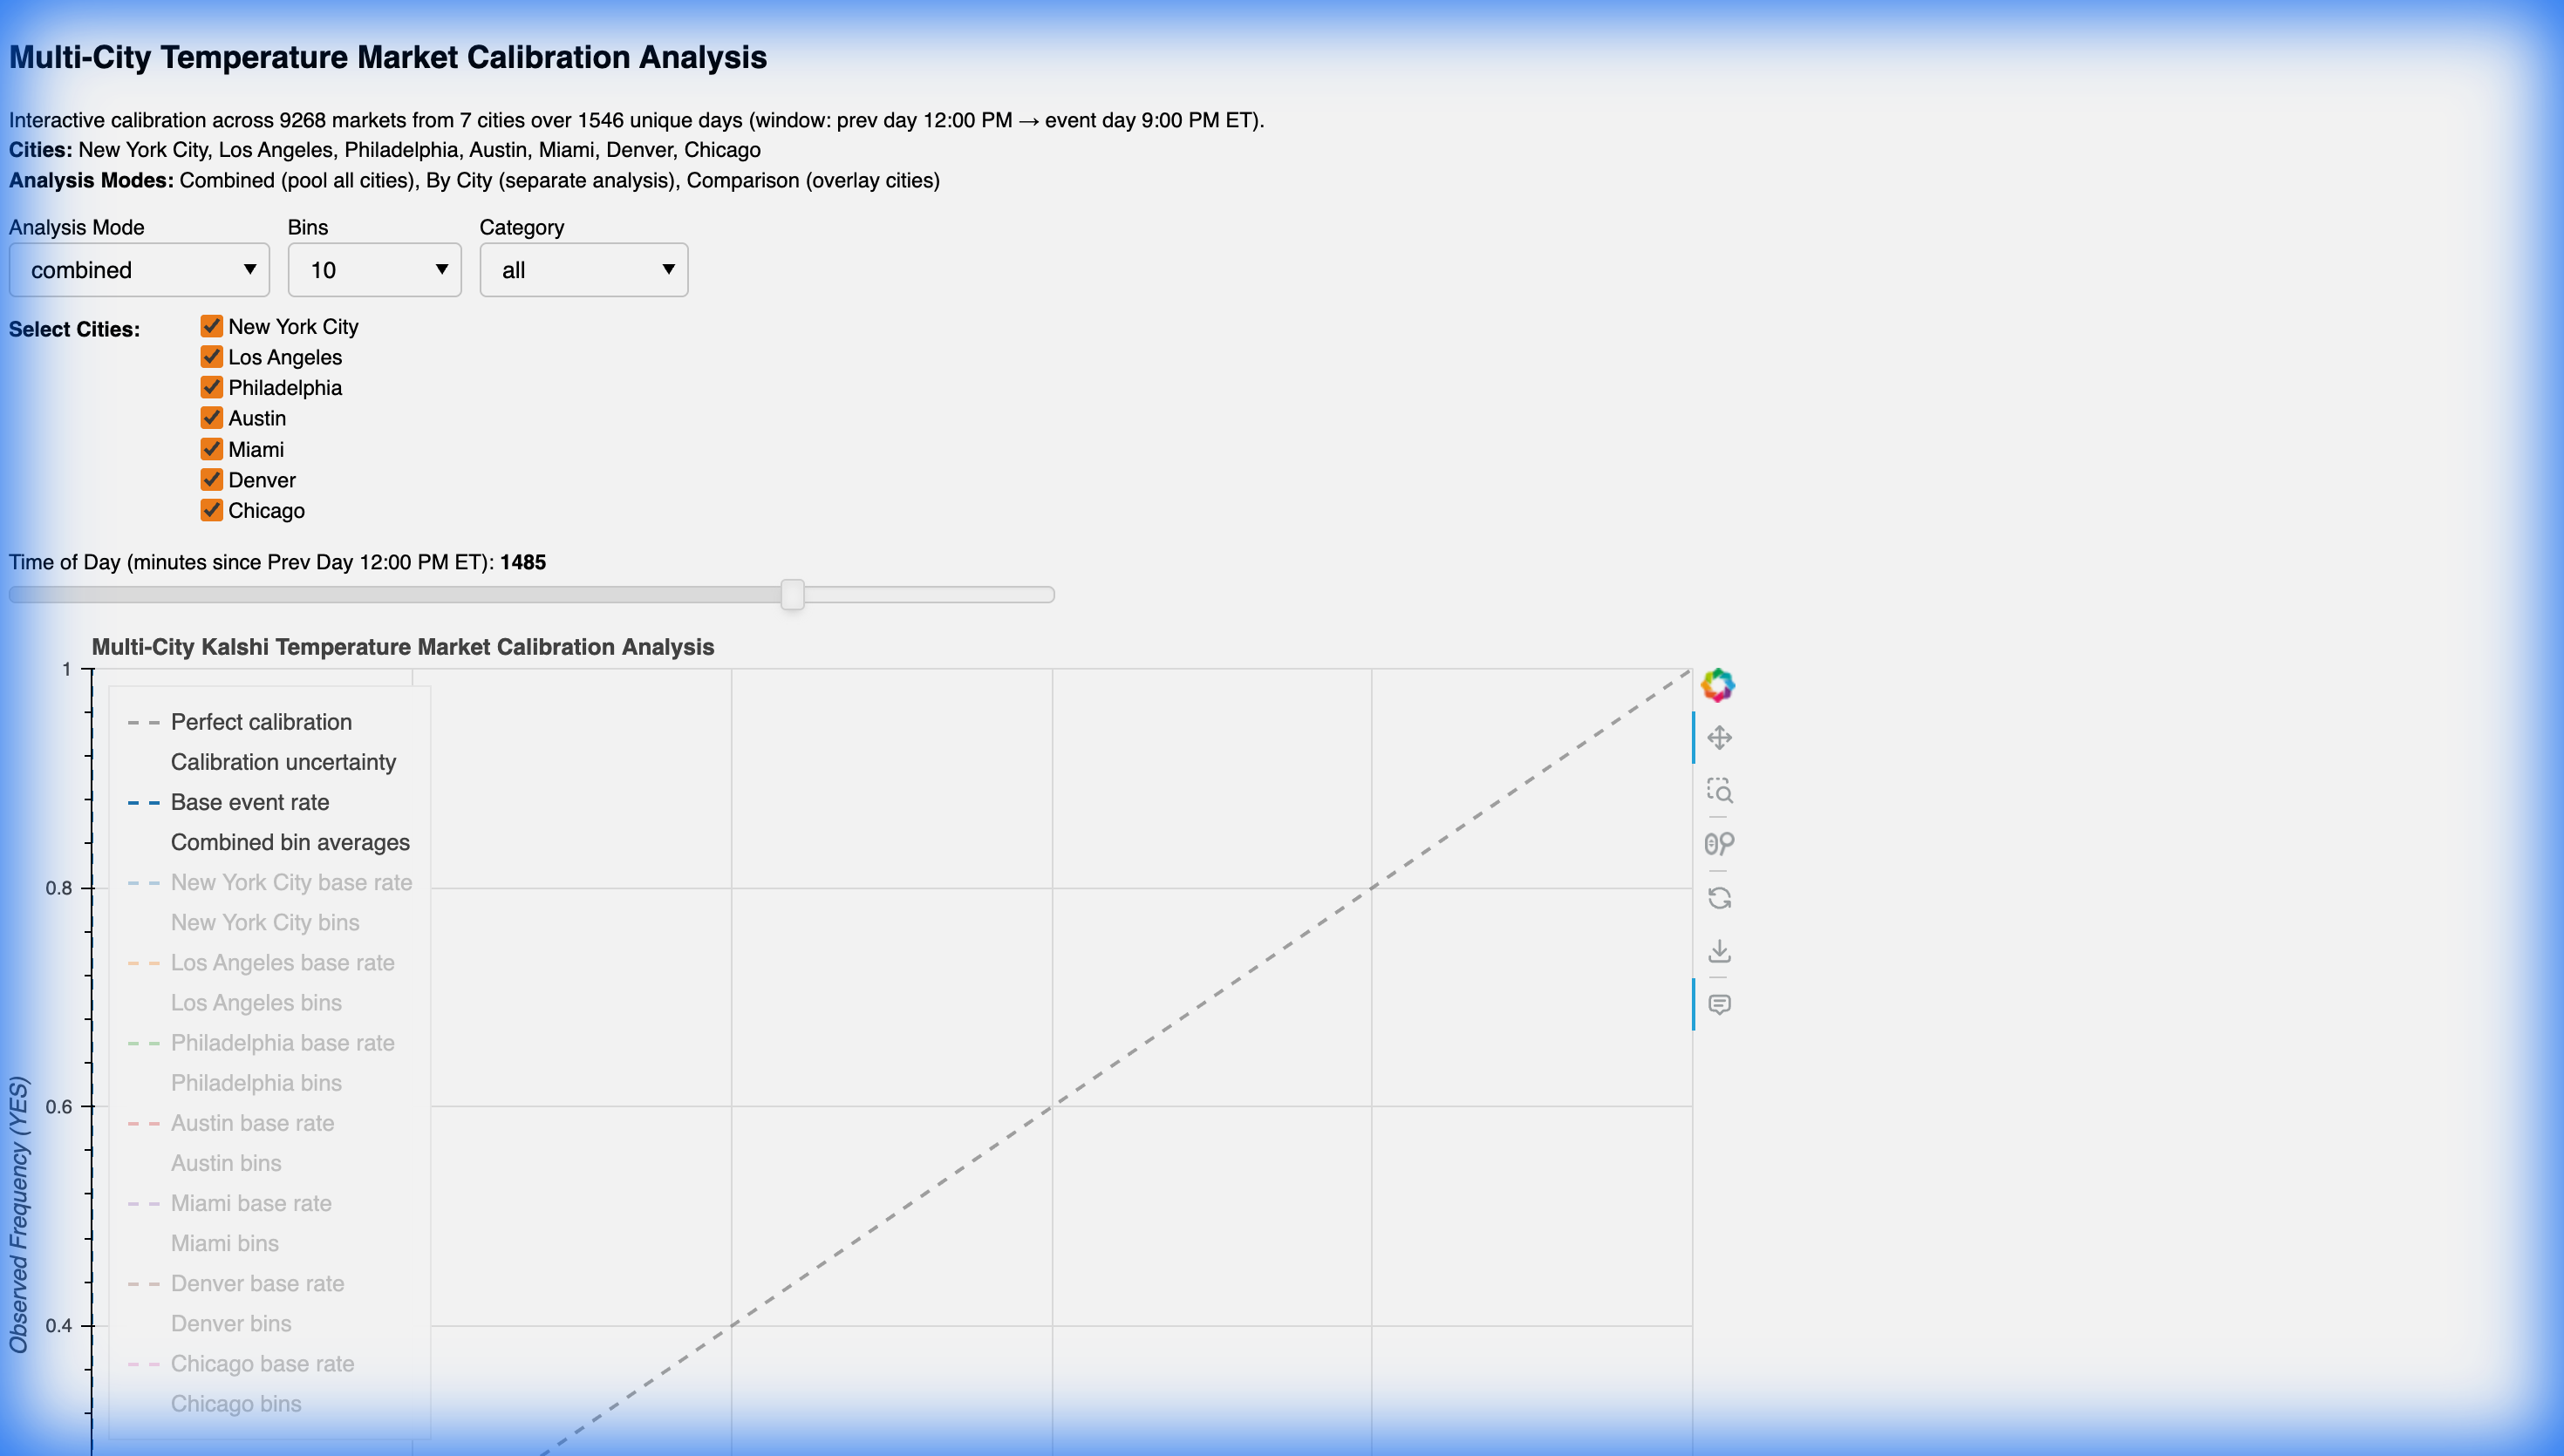
Three Analysis Modes
The dashboard supports three distinct visualization modes:
Combined Mode: Pools all selected cities for maximum statistical power, producing a single calibration curve with unified uncertainty bands. This is the most robust approach for overall market calibration assessment.
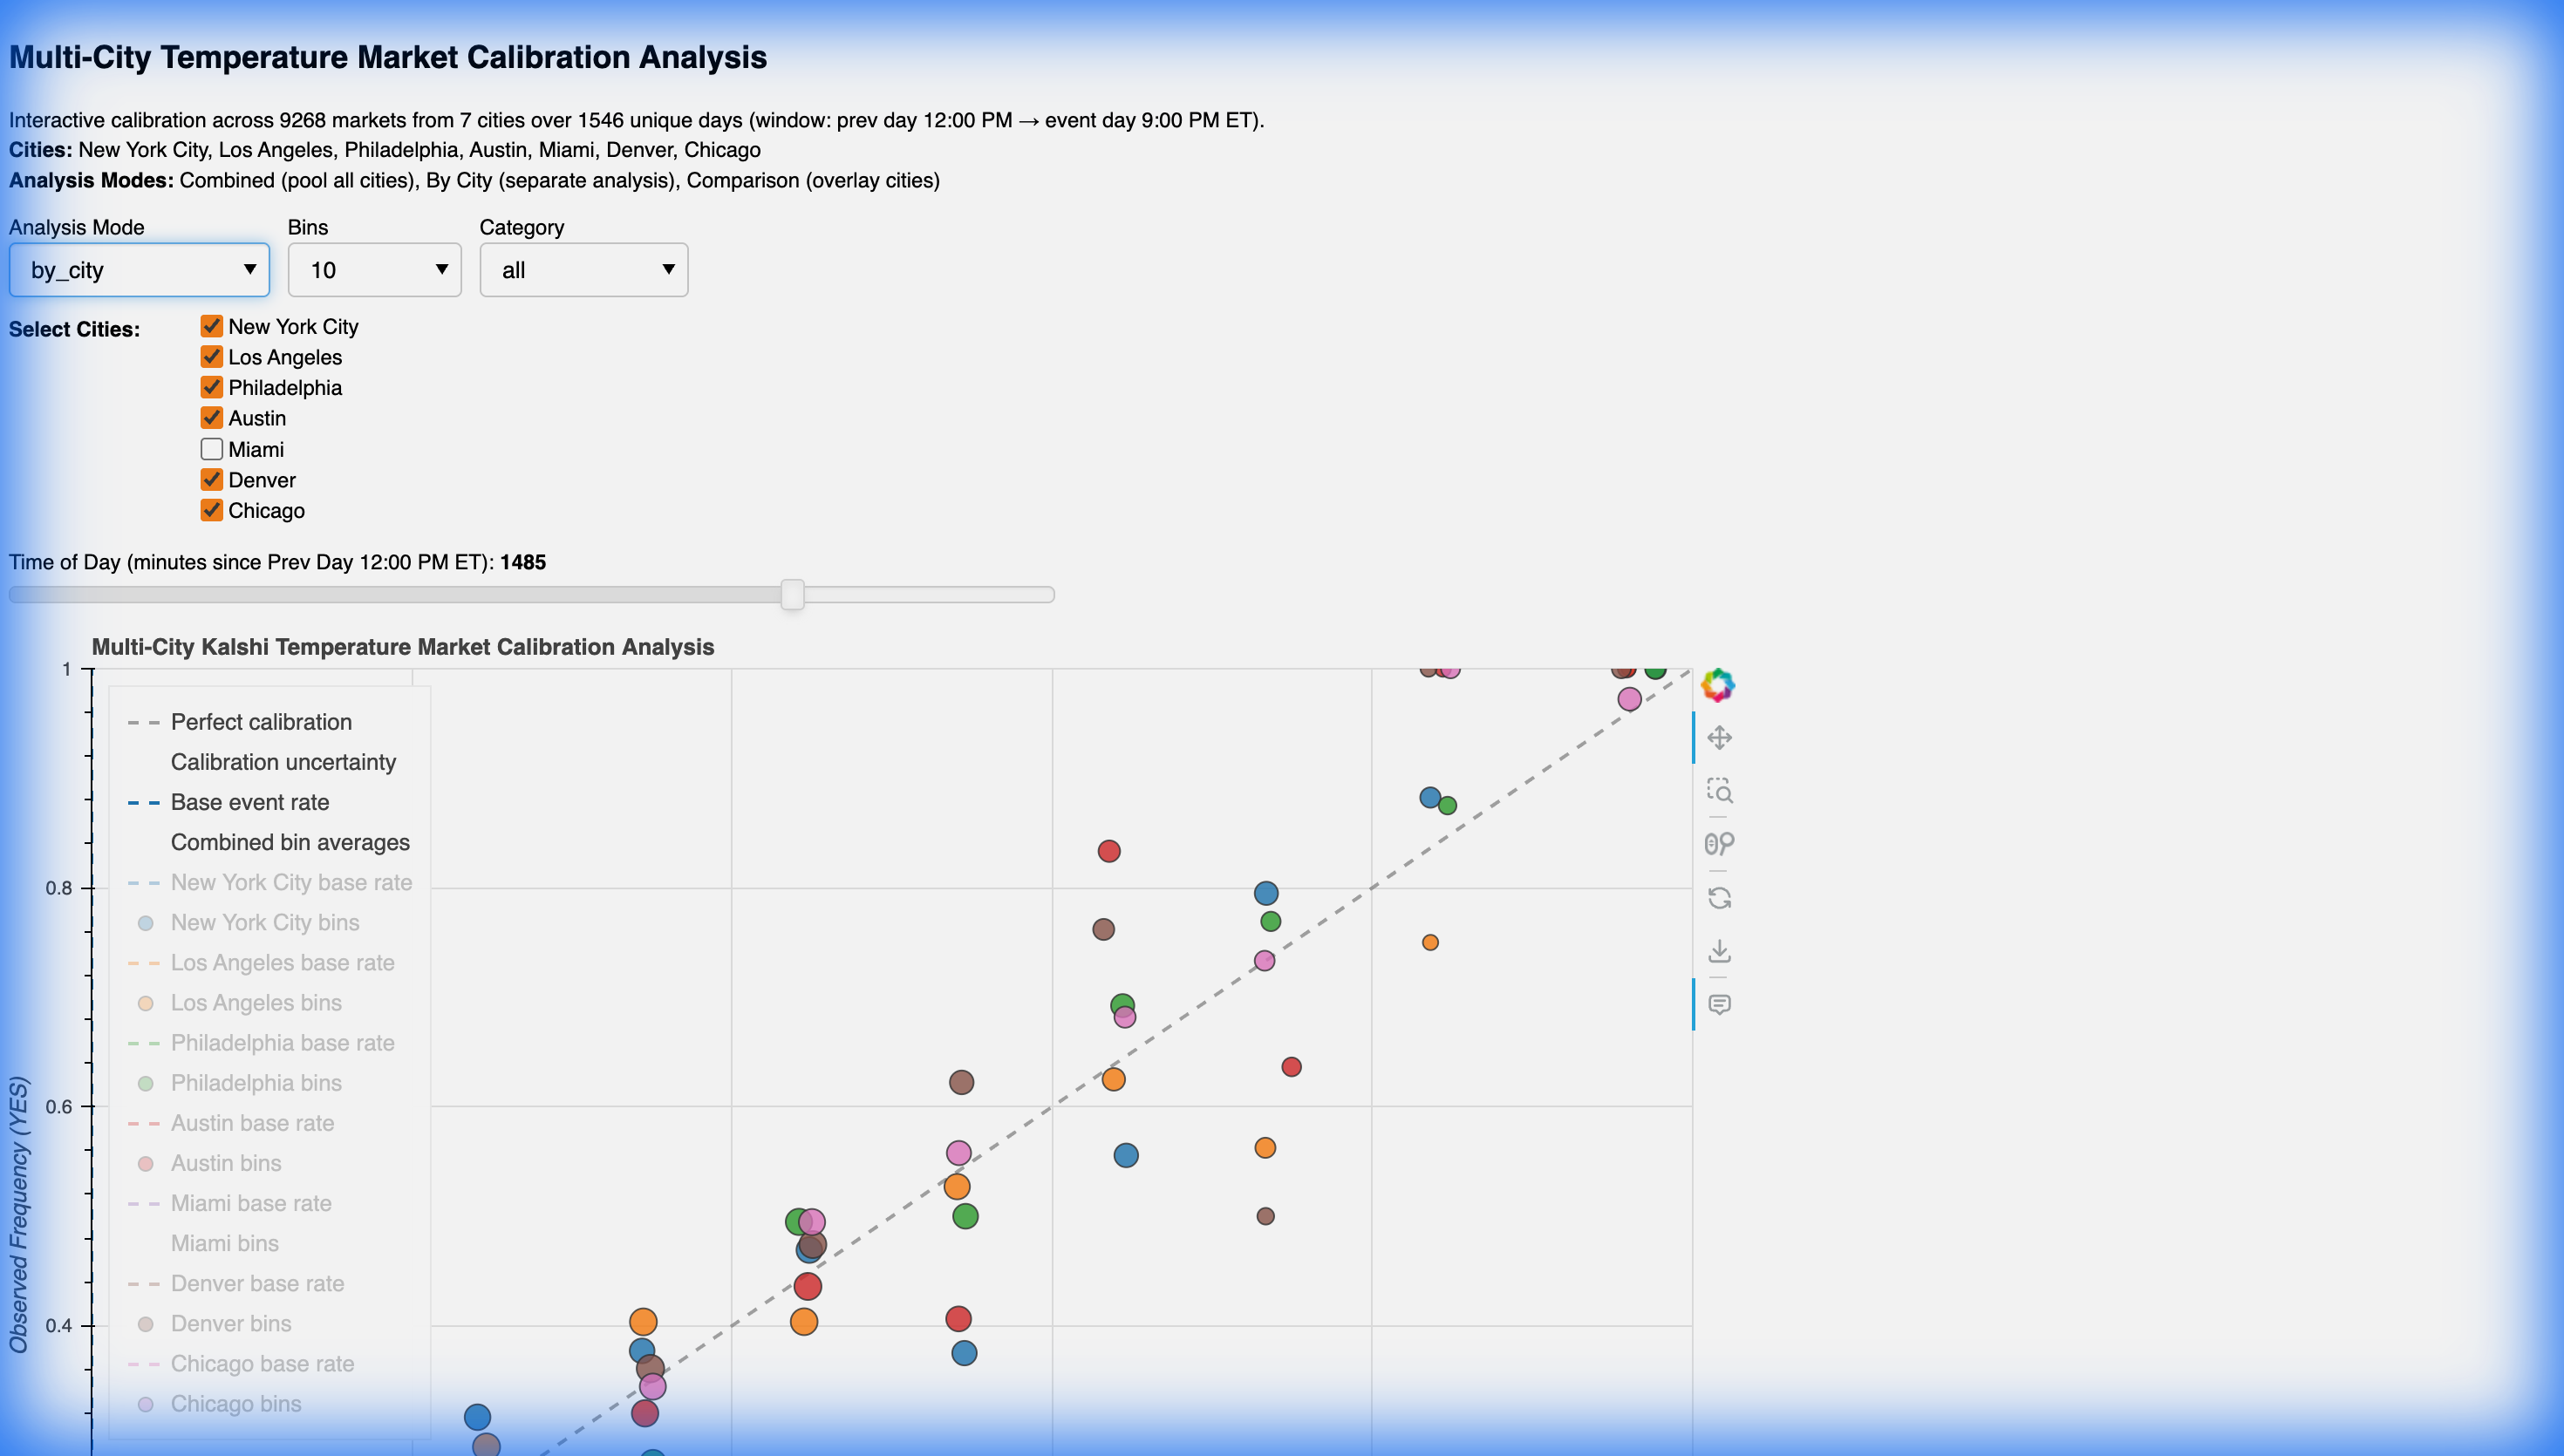
By City Mode: Analyzes each city separately with individual calibration curves and city-specific uncertainty bands. Ideal for identifying regional forecasting differences.
Comparison Mode: Overlays multiple cities on the same plot with city-specific colors, enabling direct side-by-side skill comparison.
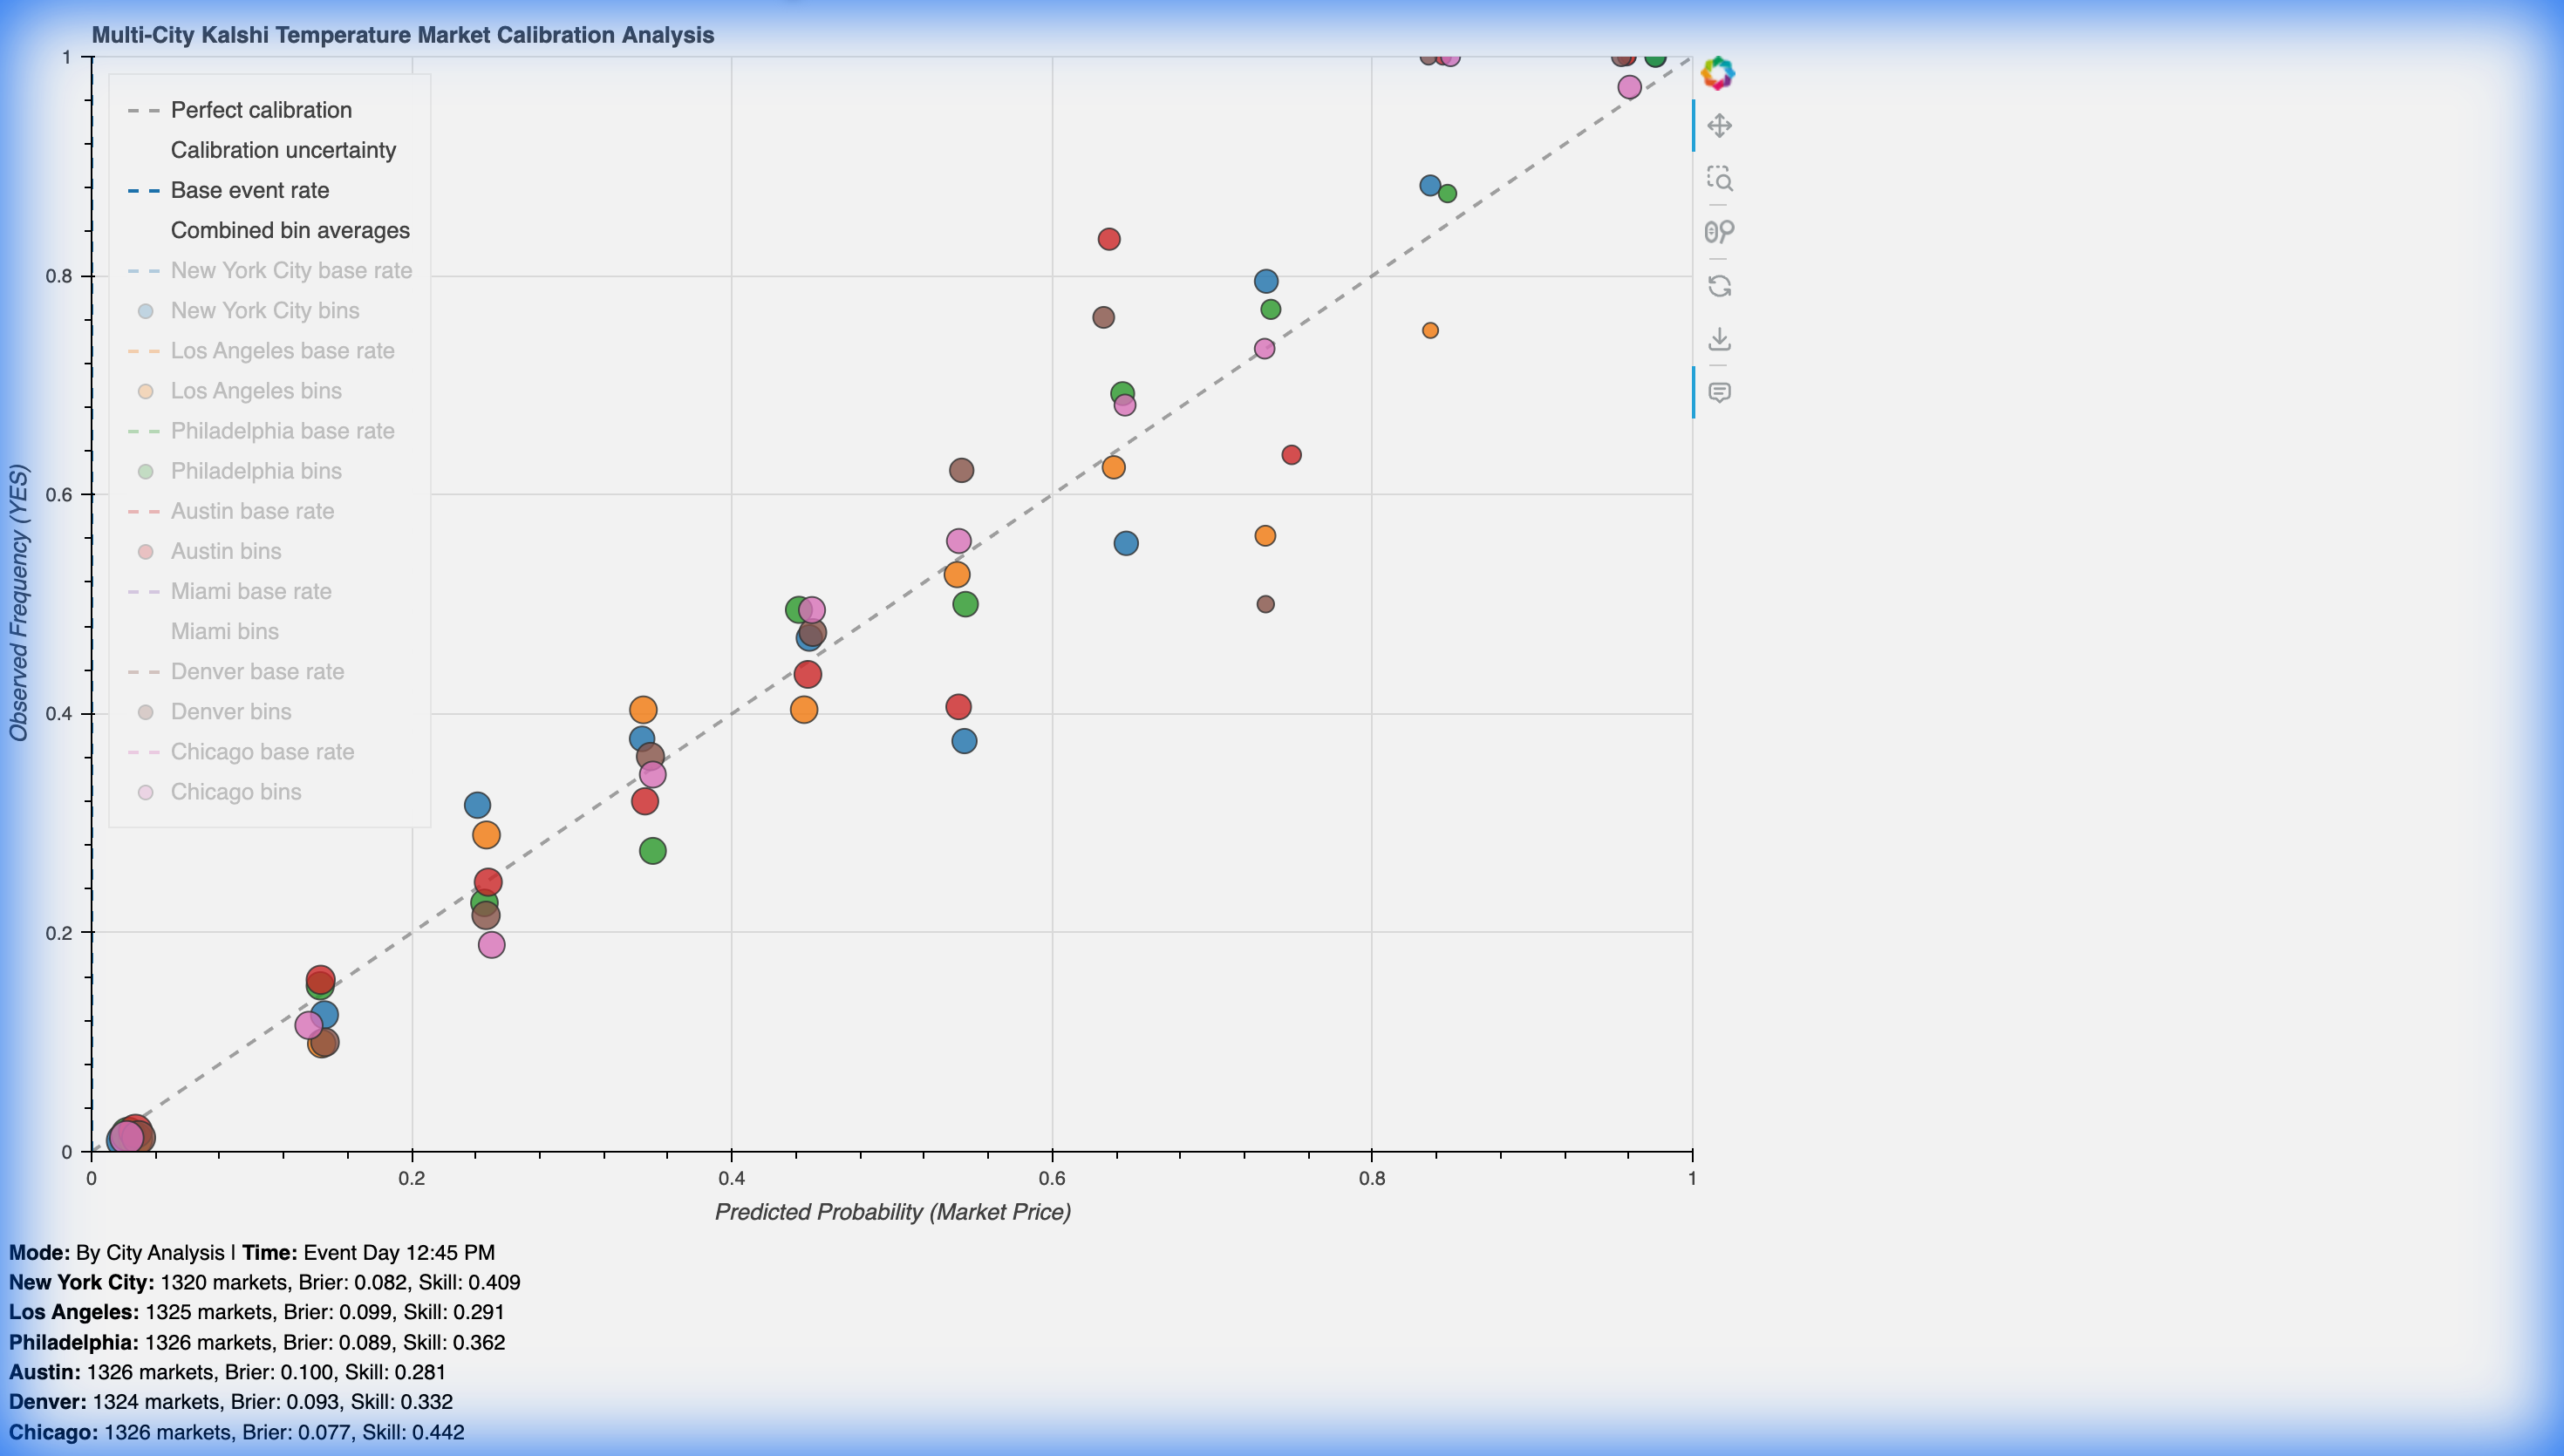
Calibration Metrics
To evaluate accuracy, the analysis focuses on the Brier Score, which measures the mean squared difference between predicted probabilities and actual outcomes. More importantly, it calculates the Brier Skill Score (BSS) to determine if the market is actually "skillful" compared to a simple base rate prediction (the historical frequency of the event).
Interactive Features
The Bokeh dashboard includes several interactive controls powered by JavaScript callbacks:
Time Slider: Analyze calibration at any point from market open to event resolution, showing how forecast accuracy evolves as the event approaches.
Bin Selection: Choose from 5, 10, 20, 50, or 100 probability bins to adjust granularity.
City Selection: Check or uncheck specific cities to include in the analysis.
Category Filtering: Filter markets by average probability (very_low to very_high) to focus on specific market conditions.
Regional Climate Considerations
Different cities show fascinating variations in market performance. Cities with more predictable climates (like Miami) often have higher base rates but may show different calibration patterns than cities with high-variability continental climates (like Denver or Chicago).
Next Steps
Future enhancements could include live tracking of ongoing markets, automated daily updates, and expansion to other Kalshi event categories beyond temperature.
You can explore the full interactive dashboard locally by running the Python script, or check out the source code and documentation on GitHub.