Instructions
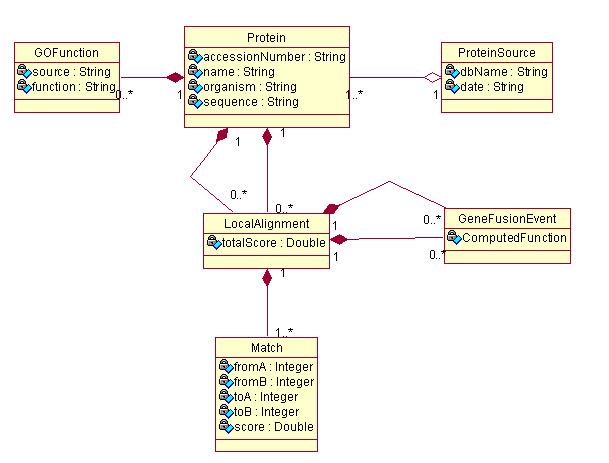
Please refer to the solution given here to create table
The GO (Gene Ontology) database resides in a MySQL database server. Therefore you need to install the MySQL JDBC driver to access the database.
Download the MySQL JDBC driver from here.
Add the MySQL JDBC driver to your Java classpath in the same way you set up the classpath for the PostgreSQL JDBC driver.
The code for connecting to the MySQL database is provided to you. You can make the same kind of JDBC calls as you did with PostgreSQL. The difference lies in the SQL syntax. But for basic queries, there shall be no difference.
You can check the GO database schema at http://www.godatabase.org/dev/sql/doc/tables.html
The tables we are concerned about are
gene_product: proteins, RNAs, etc.
term: GO terms.
graph_path: where term1 is an ancestor of term2, though term1 may not be a direct parent of term2. Use this table to get all the ancestral (more general) terms of a GO term.
association: direct association between gene products and GO terms. Use this table to get all the GO terms directly associated with a gene product.
Given a gene product symbol (in our case, it's the column name in the table t_protein) and assuming the symbol uniquely identifies a gene product, you need to write a function that
finds the gene product whose symbol matches the given symbol
finds all the GO terms that are directly associated with this gene product and finds their ancestral GO terms
returns all the above GO terms found
For example, given a t_protien.name = 'CEAC_ECOLI',
In gene_product table, the gene_product.id is 174666 when gene_product.symbol is 'CEAC_ECOLI'
From association table, you can find a list of rows where association.gene_product_id=174666. Each row contains a column named term_id. For example, one of such row has association.term_id=1139
In term table, when term.id=1139, the term.name is 'nucleic acid binding' and the term.acc is GO:0003676
You should insert the term.name as t_GOFunction.function and the term.acc as t_GOFunction.source in t_GOFunction table.
Additionally, from graph_path table, you can find all the ancestors of this GO term. For example, term 2703 is one the ancestors of term 1139. This is kept in a row where term1_id=2703 and term2_id=1139. You should insert all the ancestor terms into t_GOFunction table as well
Run this function for all proteins in the t_GeneFusionEvent table. Turn in your code.
Due to the version variations, some names assoicate with given sequences are not found in the newer version of go database, you can run this file to update t_protein table first
Use GoTerm.java, GeneOntology.java and ProteinFunction.java as the skeleton of your program. You have fill in the detailed steps (the TODO sections). The main() method is in ProteinFunction.java.
Let A and B be the sets of GO terms associated
with two proteins. Then ![]() is
the number of common terms between the two proteins and
is
the number of common terms between the two proteins and
![]() is the total number of
distinct terms. The overlap ratio is defined as
is the total number of
distinct terms. The overlap ratio is defined as
 .
.
We provide two methods in RosettaRelation.java:
	int overlapCount(int pID1, int pID2);
	int overlapCount(int pID1, int pID2, int pID3);
You can use them to count the number of common GO terms between two or three proteins.
Things you need to do
Write a method to count the total number of distinct GO terms associated with two or three proteins. You may do it in either of two ways:
Retrieve the rows of the t_GeneFusionEvent table using JDBC. For each row, there are three distinct proteins.
For each row, use the overlapCount() methods to count the term overlaps. There shall be three calls to the method with two argments and one call to the method with three arguments. You will have to marshall the protein ids from the rows of the rosetta table and pass them as arguments to the given methods.
Also call the methods you write to count the total number of distinct terms associated with two or three proteins.
Compute the overlap ratios (as described in the overview document) by dividing the numbers of common terms by the corresponding total numbers of distinct terms.
You final output should be a table of the form
| Rosetta Relation | Overlap Ratios | |||||
| Protein ID 1 | Protein ID 2 | Protein ID 3 | P1 & P2 | P2 & P3 | P1 & P3 | P1 & P2 & P3 |
| 18 | 17 | 9 | 0.143 | 0.194 | 0.472 | 0.133 |
You may choose to display protein names instead of IDs. The result shown in the above table is for TOP2_YEAST, HIS2_YEAST and GYRA_ECOLI.