Unit 4.3.7 Discussion
¶If we also show the performance on Robert's laptop of the reference implementation when using multiple threads (4 in this graph) we get
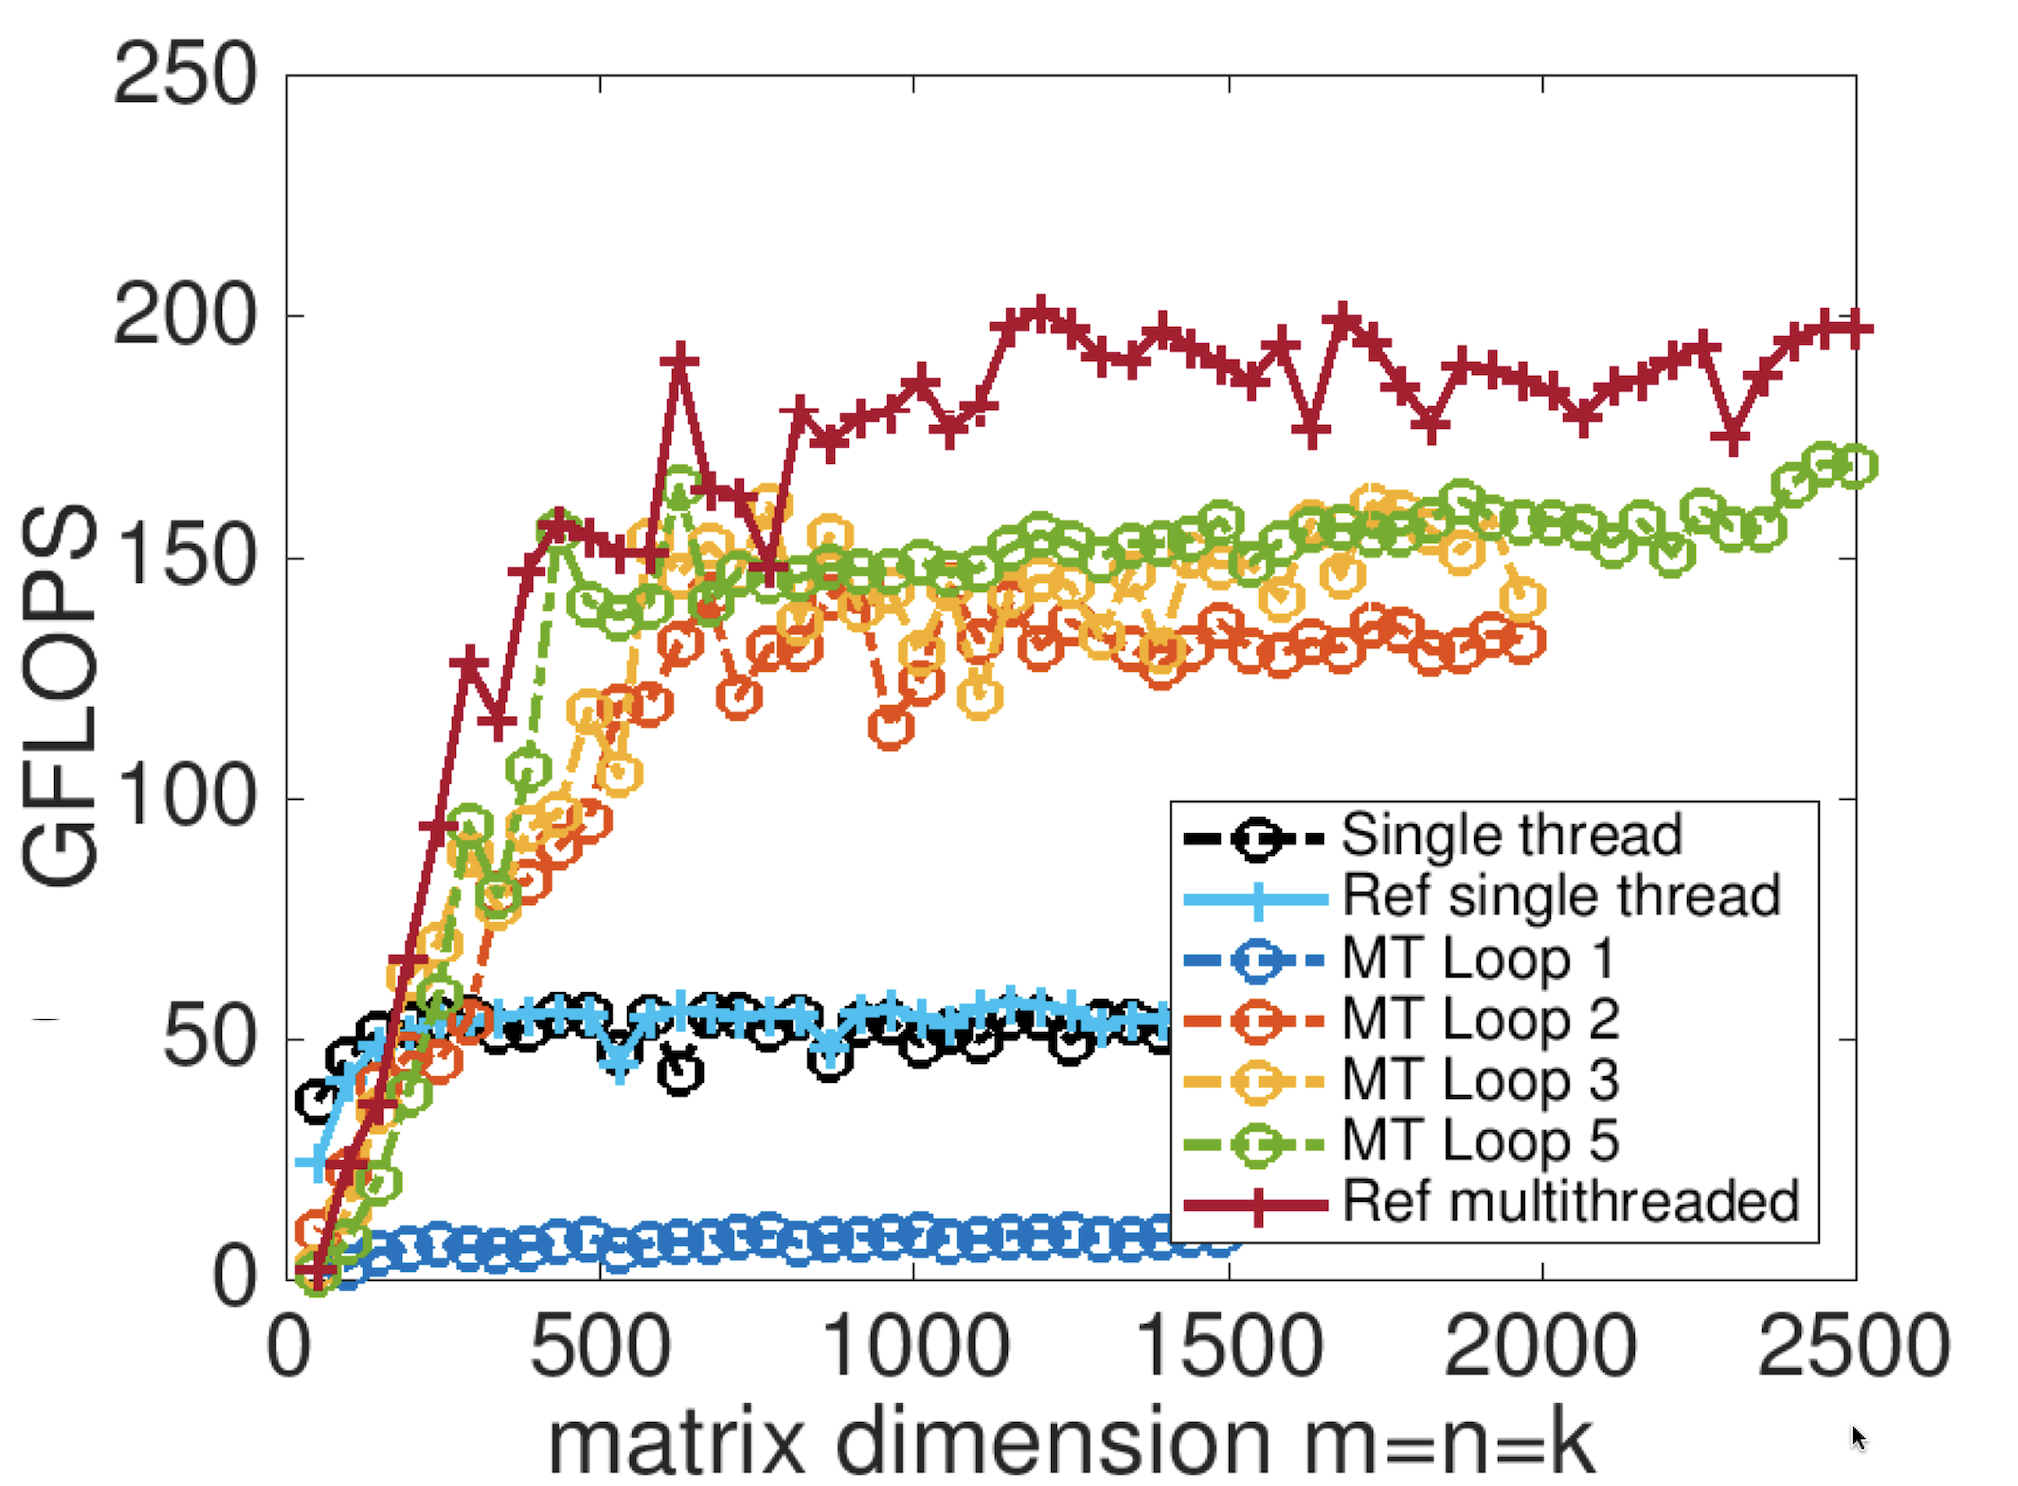
The difference in performance between the multithreaded version of the reference implementation and the performance of, for example, the version of our implementation that parallelizes the fifth loop around the micro-kernel may be due to the fact that for our implementation runs "hotter" in the sense that it exercises the cores to the point where the architecture "clocks down" (reduces the clock speed to reduce power consumption). It will be interesting to see what happens on your computer. It requires further investigation that goes beyond the scope of this course.
For now, let's be satisfied with the excellent performance improvements we have achieved. Here is a graph that shows GFLOPS along the y-axis instead of GFLOPS/thread. Remember: we started by only getting a few GFLOPS back in Week 1, so we have improved performance by two orders of magnitude!