


The basic phenomena of orientation illusions are demonstrated in figure 4 (left). On the top, is the effect of orientation contrast (also called tilt illusion): within the two surrounding circles there are tilted lines; the orientation of a center rectangle appears rotated to the opposite side of its surrounding tilt. Both the two rectangles and the one without surround (at the left-center of this figure) are, in fact, exactly same. On the bottom, is the effect of orientation adaptation (also called tilt aftereffect): if one fixates at the small circle in one of the two big circles with tilted lines for 20 seconds or so and then look at the rectangle without surround, the orientation of the lines of the rectangle appears tilted to the opposite side.
These two effects of orientation illusions are both in the direction of
repulsion: the apparent orientation of a line is changed to increase its
difference from the inducing line. Careful experimental measurements
also revealed that the angle with the inducing line is  for maximum orientation adaptation effect [3] but
  for orientation contrast [23].
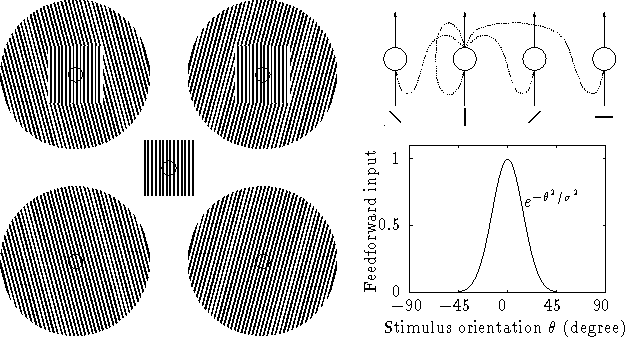
Figure 4:
The effects of orientation contrast (upper-left) and orientation
adaptation (lower-left) are attributed to feedback connections between
cells tuned to different orientations (upper-right, network;
lower-right, tuning curve).
Orientation illusions are attributed to the feedback connections between
orientation selective cells. This is illustrated in
figure 4 (right). On the top is the network of orientation
selective cells with feedback connections. Only four cells are shown.
From the left, they receive orientation selective feedforward inputs
optimal at  ,
,  ,
, , and
, and  , respectively. The dotted
lines represent the feedback connections (only the connections from the
second cell are drawn). On the bottom is the orientation tuning curve
of the feedforward input for the second cell, optimally tuned to
stimulus of
, respectively. The dotted
lines represent the feedback connections (only the connections from the
second cell are drawn). On the bottom is the orientation tuning curve
of the feedforward input for the second cell, optimally tuned to
stimulus of  (vertical), which is assumed to be Gaussian of width
 . Because of the feedback connections, the output of the
second cell will have different tuning curves from its feedforward
input, depending on the activities of other cells.
. Because of the feedback connections, the output of the
second cell will have different tuning curves from its feedforward
input, depending on the activities of other cells.
For primary visual cortex, we suppose that there are orientation
selective neurons tuned to all orientations. It is more convenient to
use the continuous variable  instead of the index i to
represent neuron which is optimally tuned to the orientation of angle
instead of the index i to
represent neuron which is optimally tuned to the orientation of angle
 . The neuronal activity is represented by
  and the
feedforward input to each neuron is represented by
and the
feedforward input to each neuron is represented by  . The
feedforward input itself is orientation selective: given a visual
stimulus of orientation
. The
feedforward input itself is orientation selective: given a visual
stimulus of orientation  , the input is
This kind of the orientation tuning has been measured by experiments
(for references, see [22]). Various experiments give a
reasonable tuning width around  (
( is used for all the
predictions).
is used for all the
predictions).
