|

|
Description
QTM(Quality Triangle/Tetrahedral Meshes) constructs quality meshes for implicit solvation models of biomolecular structures starting from atomic resolution data in the Protein Data Bank (PDB).
- A smooth volumetric electron density map is constructed from atomic data using weighted Gaussian isotropic kernel functions and a two-level clustering technique.
- A modified dual contouring method is used to extract triangular meshes for the surface, and tetrahedral meshes for the volume inside or outside the molecule within a bounding sphere/box of influence.
- Geometric flow techniques are used to improve the surface and volume mesh quality.
|
References
S. Goswami, A. Gillette and C. Bajaj
Efficient Delaunay Mesh Generation from Sampled Scalar Functions
Proc. of the 16th International Meshing Roundtable, 2007, pp. 495-511, NIHMSID194108.
Y. Zhang, G. Xu and C. Bajaj
Quality Meshing of Implicit Solvation Models of Biomolecular Structures
Computer Aided Geometric Design, 2006, 23(6), pp. 510-530. (pdf)
Y. Zhang, C. Bajaj and B. Sohn
3D Finite Element Meshing from Imaging Data
Journal of Computer Methods in Applied Mechanics and Engineering (CMAME) on Unstructured Mesh Generation, 2005, 194(48-49), pp. 5083-5106, http://tinyurl.com/PMC2748876, PMCID: PMC2748876.
|
Download
|
Software Usage
|
Further Details
- QTM generation procedure:
(click images to enlarge)
1. Implicit solvation models.

(a) Implicit solvation models of Thermus Thermophilus small Ribosome 30S (1J5E) crystal subunit for
various Gaussian kernel parameters. The pink color shows 16S rRNA and the remaining colors are proteins.

(b) Implicit solvation models of Haloarcula Marismortui large Ribosome 50S (1JJ2) crystal subunit.
The light yellow and the pink color show 5S and 23S rRNA respectively, the remaining colors are proteins.
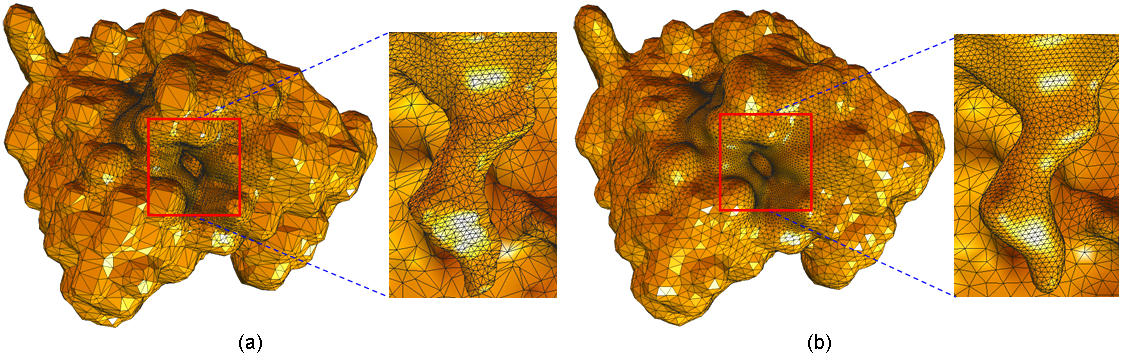
2. Surface Smoothing.

(a) Comparison of mAChE (9308 vertices, 18612 triangles) before and after surface smoothing. (a) -
original; (b) - after smoothing.

(b) Comparison of Ribosome 30S (13428 vertices, 26852 triangles) before and after surface
smoothing. Left - original; Right - after smoothing.
3. Interior/Exterior Tetrahedral Meshes.

Interior and exterior tetra meshes of monomeric mAChE.
The left two pictures conform to the SAS with sigma=2, and the
right two pictures conform to the surface constructed from
Gaussian summation with p1=0.25, p2=1.0. From left to
right: (65147 vertices, 323442 tets), (121670 vertices, 656823
tets), (103680 vertices, 509597 tets) and (138967 vertices, 707284
tets). The color shows potential (leftmost) or residues (the right
two).

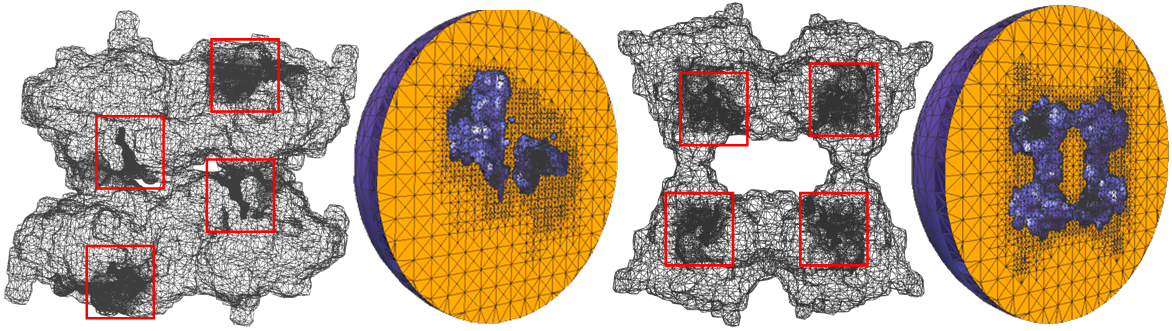
Interior and exterior tetra meshes of tetrameric mAChE,
p1=0.5, p2=1.0. The left two pictures show the 1st
crystal structure 1C2O (133078 vertices, 670950 tets), and the
right two pictures show the 2nd one 1C2B, (106463 vertices, 551074
tets). Cavities are shown in red boxes.

Interior and exterior tetra meshes of Ribosome 30S, low
resolution, p1=0.03125, p2=1.0. From left to right:
(33612 vertices, 163327 tets), (37613 vertices, 186496 tets) and
(40255 vertices, 201724 tets). The pink color shows 16S rRNA and
other colors show proteins.
|
|
|