| Biography | Research | Publications | Teaching | Group | Projects | Software | Sponsors | Collaborators |
Visualization of Oceanography Time-Varying Volume Data
 |
 |
|
|
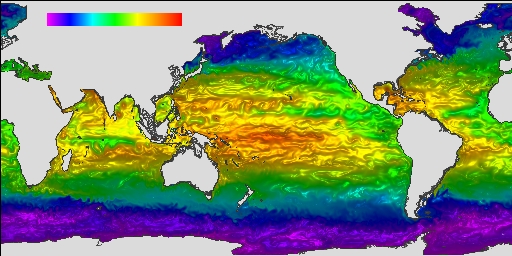
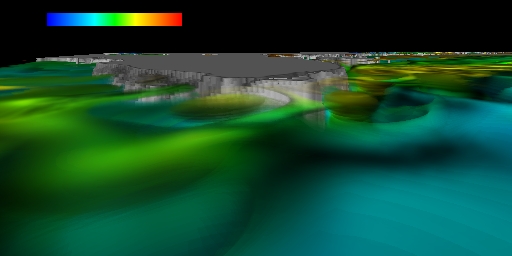
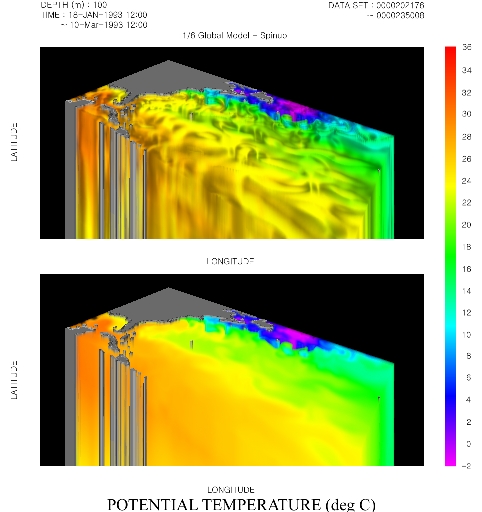
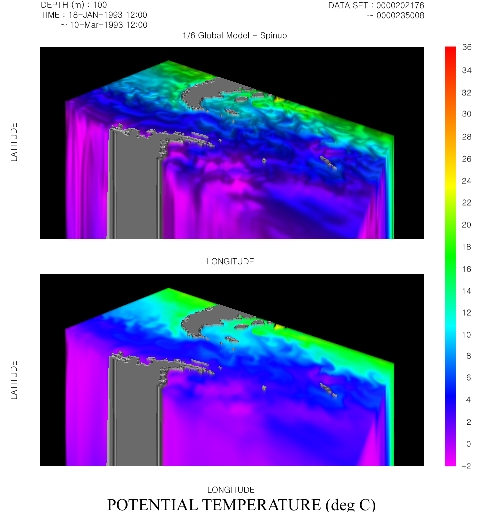
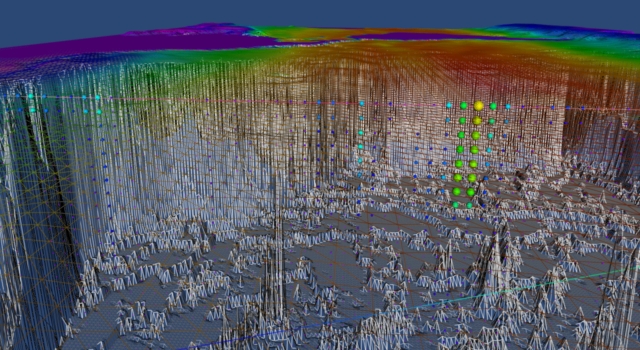
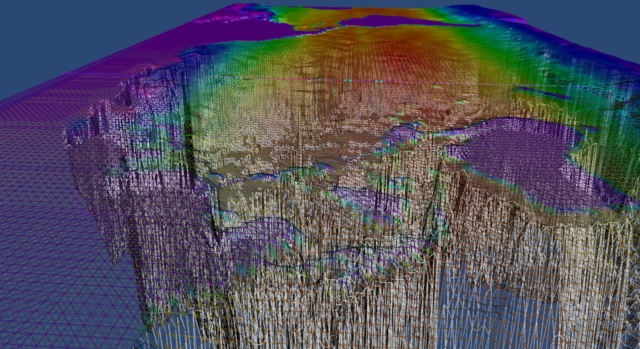
Combinied volume rendering and isocontouring method
|
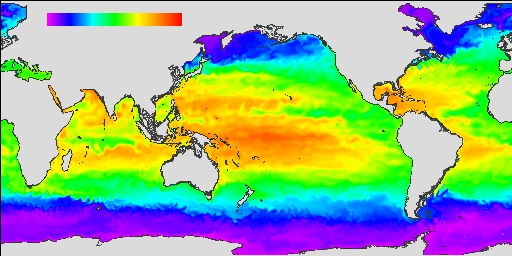
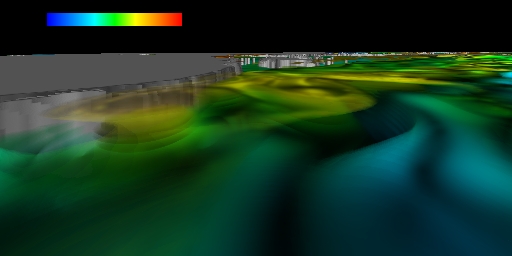
Color mapped method
|
|
|
Figure 1: Comparison of two rendered images of
tepmerature data
|
||
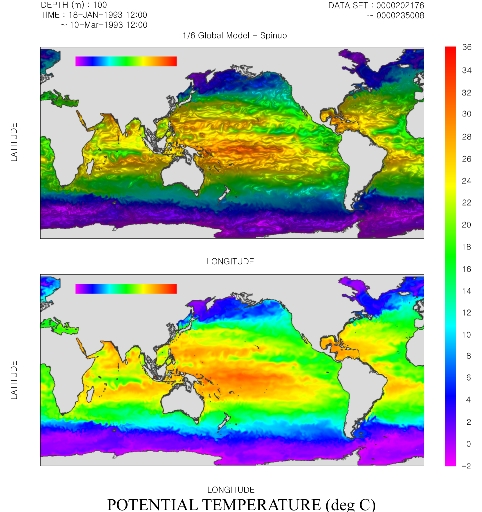
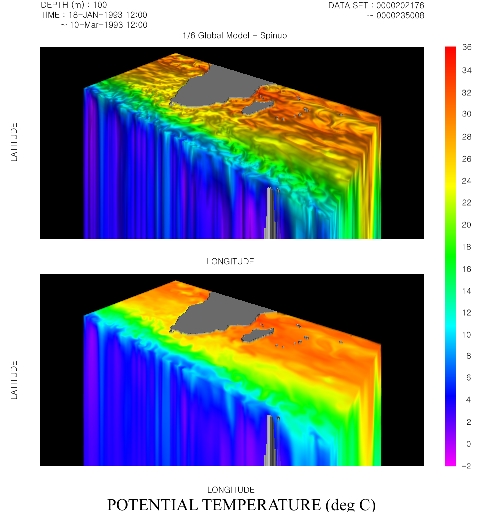
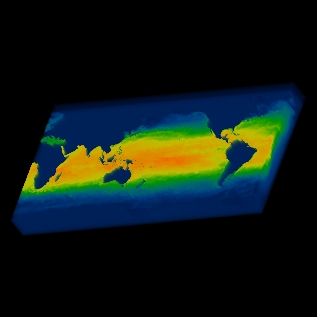
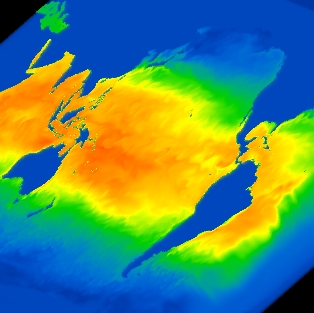
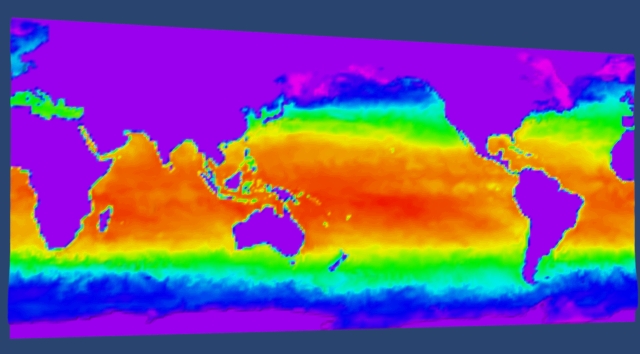
Understanding the general circulation of the ocean in the global climate system is critical to our ability to diagnose and predict climate changes and their effects. Recently, very high quality time-varying volume data, which consists of a sequence of 3D volume data, was generated in the field of oceanography. The model has a resolution of 1/6 degree (2160 by 960) in latitude and longitude and carries information at 30 depth levels. It includes several time-steps, scalar, vector field data sets: temperature, salinity, velocity, ocean surface height, and ocean depth. The datasets are from a 121 day SIO(Scripps Institution of Oceanography) oceanographic simulation. The timestep interval is 300 seconds beginning on Feb-16-1991 at 12:00:00. Since each voxel is 4 bytes, the total size of the data is about 134 giga bytes.
|
Name
|
Data
Set
|
Attributes
|
Dimensions
|
Timesteps
|
Size
|
|
T
|
Temperature |
Scalar
|
2160 x 960 x 30
|
121
|
28.0 GB
|
|
S
|
Salinity |
Scalar
|
2160 x 960 x 30
|
115
|
26.7 GB
|
|
Vel
|
Velocity |
Vector (U,V,W)
|
2160 x 960 x 30
|
113
|
78.6 GB
|
|
PS
|
Surface Height |
Scalar
|
2160 x 960
|
114
|
0.9 GB
|
|
Figure 2: Oceanography dataset
|
|||||
In general, oceonographers have used pre-defined color mapped images. While these images are intuitive, since there is a one-to-one map between colors in the color bar and values, they remain a simple 2D plane. Therefore, it is difficult to show dynamic changes in the timesteps. On the contrary, images created by volume rendering techniques, such as ray-casting and splatting, are less intuitive because colors are determined by a special illumination model. However, they are high quality 3D images and present detailed changes between timesteps. Also, while the computational cost of volume rendering techniques is very expensive, rendering methods using color maps can generate images at an interactive or real-time rate. The above two figures clearly show the difference between the color mapped method and the traditional volume rendering method.
Basically, there are two techniques in visualizing such large time-varying volume data which requires a great deal of computing time and run-time memory space. The first method is to produce a sequence of high quality images according to a story board using massively parallel volume rendering techniques. In this case, the traditional volume rendering algorithms should be modified to effectively show dynamic appearances and changes which cannot be described by previous volume rendering or color map methods. We propose a new technique combining volume rendering and isocontouring and a parallelization scheme on high performance parallel computers.
 |
 |
 |
 |
|
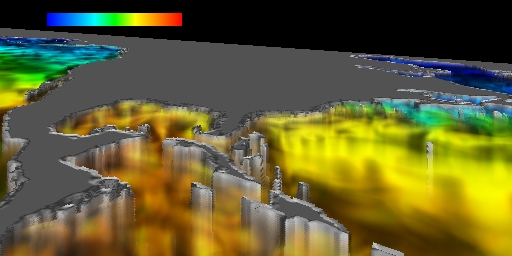
Figure 3: Images of T created by combining volume rendering and isocontouring |
|
 |
 |
 |
 |
|
Figure 4: Comparison of rendered images of T
data (upper images: our method, lower images: color mapped method)
|
|
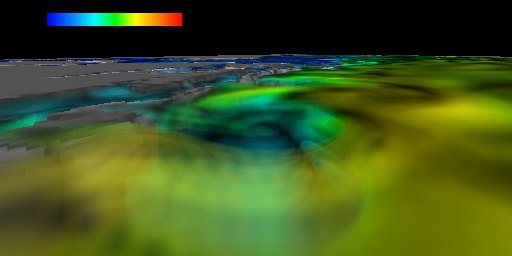
The other method is to visualize the time-varying data in real-time or interactive frame rate using multipipe graphics hardware. Even though direct volume rendering has become interactively feasible on graphics workstations since 3D texture mapping ardware is available, most research is focused on static volume data smaller than the available texture memory. Recently, techniques visualizing volume data, such as seismic data and time-varying data, larger than the available texture memory have been presented. But, it is often difficult or impossible to visualize and accelerate huge time-varying volume data in real-time on general purpose workstations with a single pipe. We implemented a real-time multipipe rendering method and applied it to the time-varying oceanography data. Even though it doesn't create high quality 3D images due to the use of the color mapped method, we can freely control rendering parameters, such as camera position and direction, current timestep, and color map in real-time.
 |
 |
|
Figure 5: Real-time multipipe time-varying volume
rendering of T data
|
|
 |
 |
 |
 |
|
Figure 6: Fly-through using the OpenGL Performer
(T, SP, Vel)
|
|
Papers
Sanghun Park, C. Bajaj, and I. Ihm, "Effective Visualization of Very Large Oceanography Time-varying Volume Dataset", CS & TICAM Technical Report, University of Texas at Austin, 2001 [pdf]
Sanghun Park, Sangmin Park, C. Bajaj, "Hardware Accelerated Multipipe Parallel Rendering of Large Data Stream", CS & TICAM Technical Report, University of Texas at Austin, 2001 [pdf]
Acknowledgements
We would like to greatly thank Prof. Detlef Stammer for providing access to the oceanography simulation data as well as for numerous interactions. This work was supported in part by the NPACI Alpha Project: Large Data Visualization.