|
Using the two-phase flow model in the IPARS simulator
and 64 nodes of the IBM SP2 at Pacific Northwest National Laboratory,
Center for Subsurface Modeling researchers examined the behavior
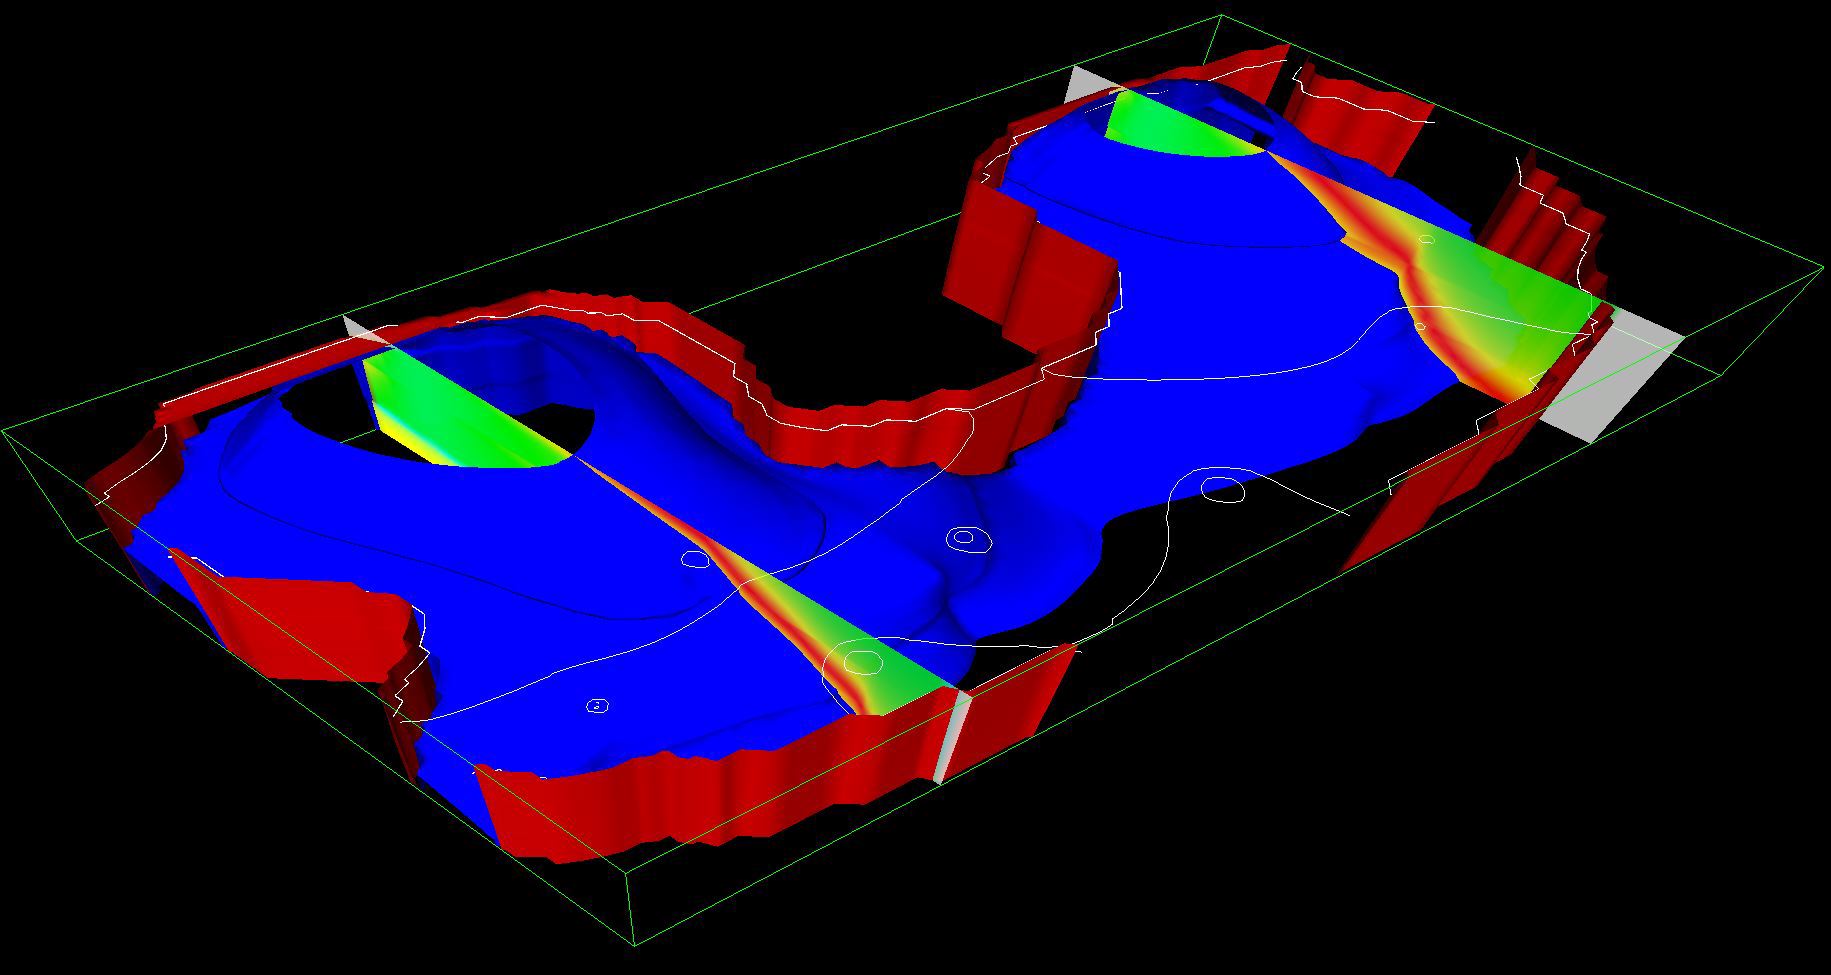
of a million-grid-block reservoir with four injection and twelve production wells.
The displacement front advancing from the injection wells is clearly seen
in the upper contour plot, with the variation in water saturation at the bottom of
the reservoir projected onto the plane below. This plane also shows the computational mesh,
which is refined in both horizontal directions around each well,
and the irregular boundary of the reservoir.
|
Additional
information for Computational Geophysics & Petroleum Engineering
|
|
|
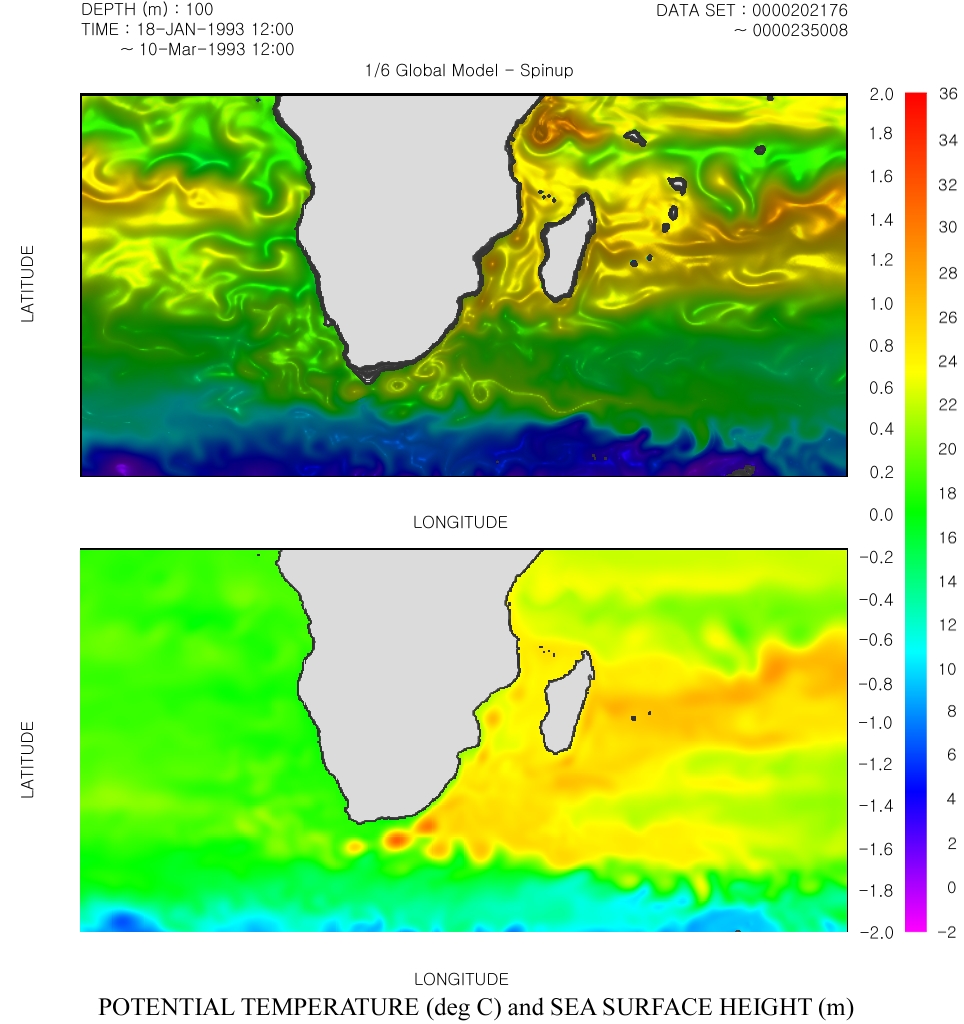
Left image shows potential temperature and sea surface height.
Understanding the general circulation of the ocean
global climate system is critical to our ability to diagnose
and predict climate changes and their effects.
Additional
images of global oceanographic visualization
|
|
Collaborators
Manfred Auer (LBL,UCB)
Tim Baker (UCSD)
Nathan Baker (WashU)
Rohit Bhargava (UIUC)
Steve Ludtke (Baylor)
Pradeep Ravikumar (UT, CS)
Ron Elber, Peter Rossky (UT, ICES)
Joachim Frank (Suny Albany, Columbia)
Kristen Harris, Dan Johnston (UT, ILM)
Tom Hughes, Tinsley Oden (UT, ICES)
Justin Kinney, Tom Bartol, Terry Sejnowski (Salk)
Andy McCammon, Michael Holst (UCSD)
Art Olson, Michel Sanner, David Goodsell (TSRI)
Alberto Paoluzzi, Antonio DiCarlo (Roma)
Sriram Subramaniam (NIH-NCI)
David Zuckerman (UT, CS)
Our Computational Visualization Center,
collaborates with
Earth Simulator Center (Dr. Tetsuya Sato), Yokohama, Japan for extremely large the datasets (22GB). Their transient
oceanographic dataset consists of 5 variables: temperature, salinity, U, V, W (velocity) and
4 timesteps spread over 3days.
|
|